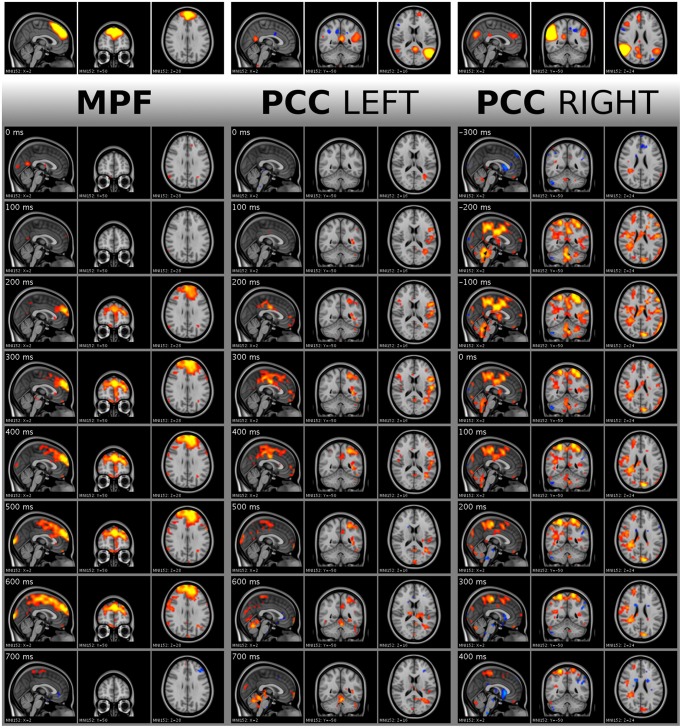
Figure 7.
Visualization of single activity avalanches in DMNmpf and DMNpcc by frame tiles with vertical time flow (from top to bottom) and 100 ms frame distances. The top frames are the analyzed ICA components cut and saturated at z-score thresholds 3 and 7, respectively. The vertically following frames are normalized BOLD data, cut and saturated at absolute threshold value 1.7 and 3.5, respectively. Values are color coded from low to high as red to yellow and blue to cyan, for positive and negative values, respectively. Activity data was smoothed with a Gaussian kernel (mean 0, standard deviation 1.2 pixels), and the voxel values outside the brain set to zero. Activity avalanche in DMNmpf and in DMNpcc left starts at frame three, in DMNpcc right starts at frame two. All three shown activity avalanches are five frames long. The BOLD values are spatially registered and thus overlaid on a standard anatomy image.

