
Fig. 5.
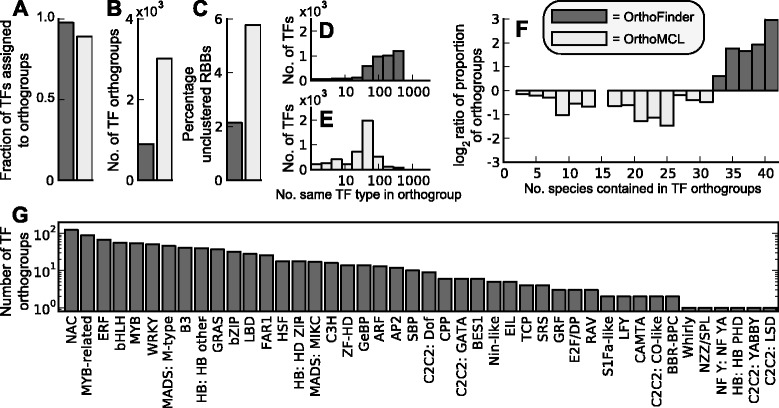
Inference of orthogroups of plant transcription factors. In all cases dark grey bars indicate the results for OrthoFinder and light grey bars indicate the results for OrthoMCL. a Comparison of the fraction of transcription factors that are assigned to orthogroups by OrthoFinder and by OrthoMCL. b Comparison of the number of transcription factor orthogroups identified using each method. c The percentage of RBNH/RBH (for OrthoFinder/OrthoMCL) hits that are not contained in orthogroups identified using each method. d The number of transcription factors of the same type that each transcription factor is connected to in the orthogroups produced by OrthoFinder. e as in (d) but for OrthoMCL. f Comparison of species coverage for transcription factor orthogroups identified by each method. g The number of orthogroups for each transcription factor type identified by OrthoFinder