
Figure 2.
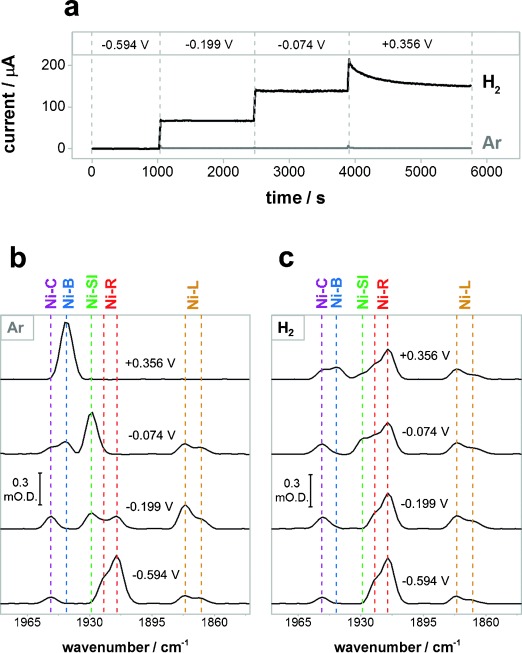
a) Current–time traces of Hyd-1 in the ATR-IR cell in Ar-saturated (gray) and H2-saturated (black) buffer; b), c) spectra showing the νCO region at each potential under Ar (b) and H2 (c). Potentials are quoted in volts (V) relative to the standard hydrogen electrode (SHE).