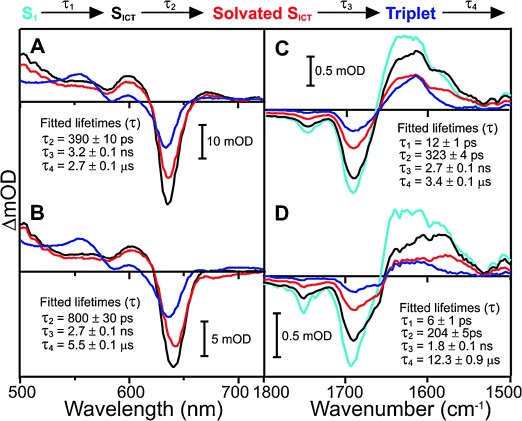
Figure 2.

Species associated difference spectra (SADS) resulting from a global analysis of the time-resolved visible data for A) Pchlide only and B) a Y193F-Pchlide-NADPH ternary complex, and the time-resolved IR data for C) Pchlide only and D) a Y193F-Pchlide-NADPH ternary complex after excitation at 450 nm. The data were fitted to the sequential model above the panel as described in the Supporting Information. Kinetic traces showing fits at selected energies are shown in figures S10 and S11.
