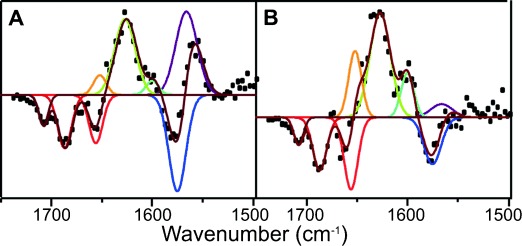
Figure 4.

Fitting of SADS5 (A) and SADS6 (B) from the global analysis of the transient IR absorption data for the wild-type POR-Pchlide-NADPH ternary complex to a sum of Gaussian functions. The SADS (black dots) have been fitted with a sum (dark red line) of the following Gaussian functions of fixed position and FWHM (in brackets). Negative peaks: 1708 (11), 1687 (16), 1656 (16) 1575 (20) cm−1. Positive peaks: 1652 (15), 1627(24), 1600 (15), 1566 (25).
