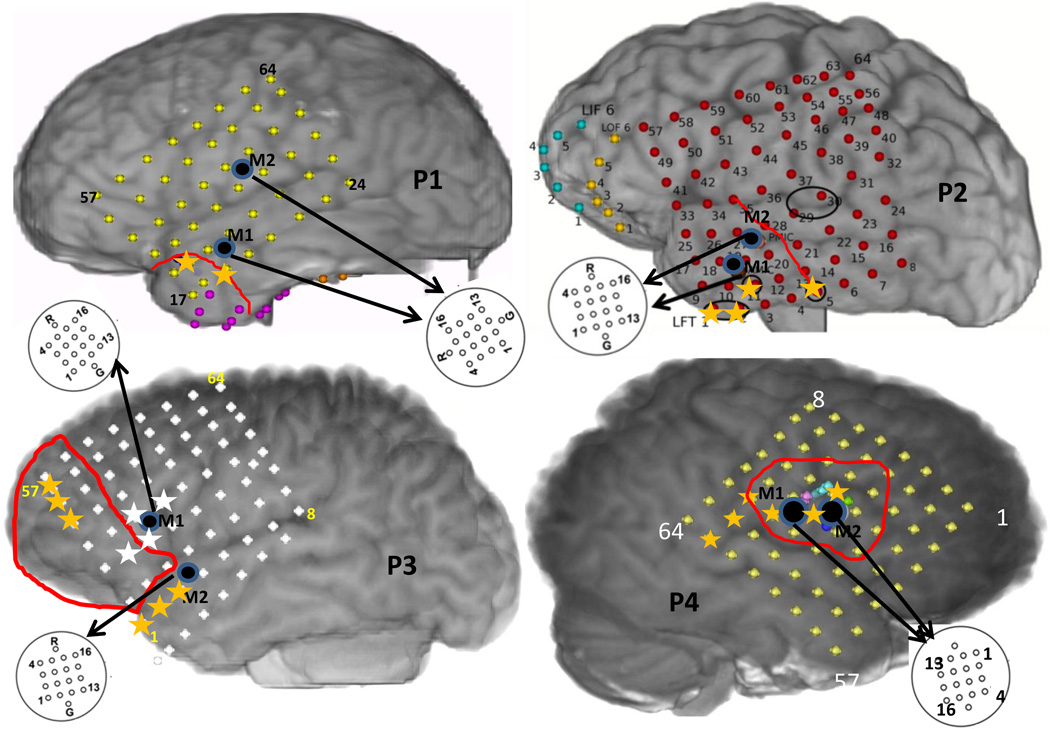
Figure 1.
The reconstructed brain maps of the 4 patients considered showing approximate positions of the macro-electrode and micro-electrode grids along with the boundaries of the resected region in red. The yellow asterisks in P1,P2,P4 indicate the SOZ macro-electrode contacts on the grid. The yellow and white asterisks in P3 denote SOZ macro-electrodes during seizures 1 and 2 respectively.

