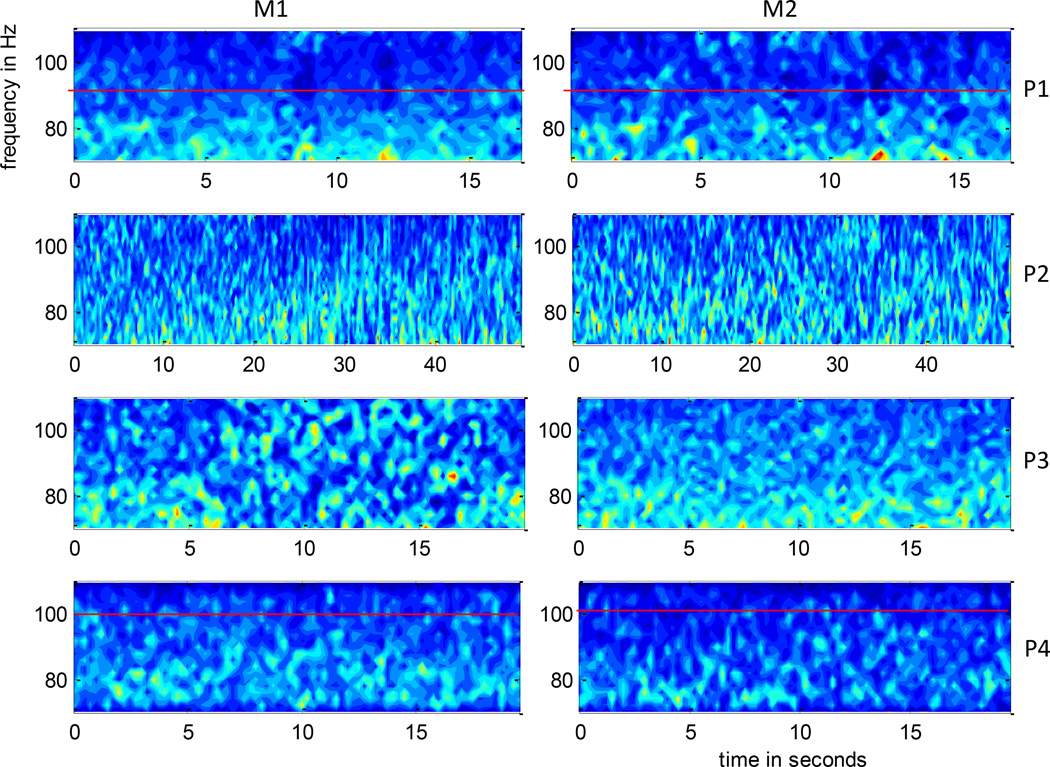
Figure 3.
Time frequency decomposition using short time Fourier Transform averaged over micro-electrode channels of M1 (left) and M2 (right) as a ratio with respect to total spectral power in 70–110 Hz, of the 4 patients P1–P4. The time interval for each patient shown here is the same as that considered for the propagation analysis. This figure gives the reader a sense of the distribution of spectral power in the 70 – 110 Hz band and the rationale behind choosing a frequency sub-band for estimating propagation. As indicated by a red horizontal line, P1 and P4 show a higher spectral power concentration in the 70–90 and 70–100 Hz ranges respectively while P2 and P3 have similar spectral power over the entire range.

