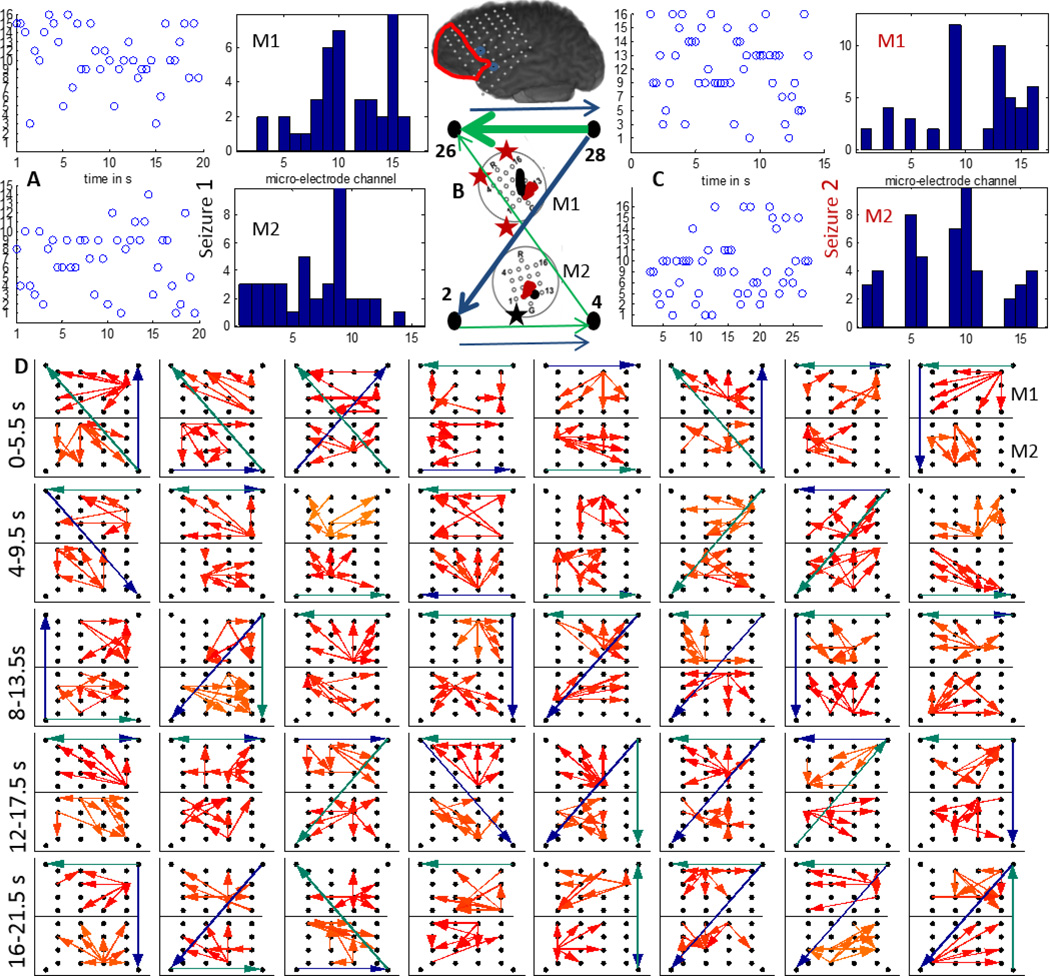
Figure 6.
A:The time evolution and histogram of micro-electrode contact emanating the maximum outflow within grids M1 and M2 during a clinical seizure (seizure 1) recorded from P3; B:The 4–50 Hz (green) and 70–110 Hz (blue) flows in the macro-channels surrounding M1 and M2. The thickness of the arrows is proportional to the number of times a particular direction of flow occurred in the entire interval considered as in D. C:Same as in A during a later seizure (seizure 2). The inset shows a schematic of the implanted grid along with M1 and M2 with the channels associated with maximum outflow marked in black (M1) and red (M2). The black asterisk shows the position of the SOZ macro-electrode closest to M1; D:Top 4 percentile of propagation in the 70–110 Hz frequency band across M1 (top) and M2 (bottom) along with the strongest flow across the neighboring macro-electrode contacts in the 4–50 Hz (green) and the 70–110 Hz (blue) frequency bands. Each square element corresponds to a time interval of 2 s and consecutive squares are separated by 0.5 s. The temporal evolution is from left to right. The 40 patterns shown thus correspond to a total duration of 20 s.

