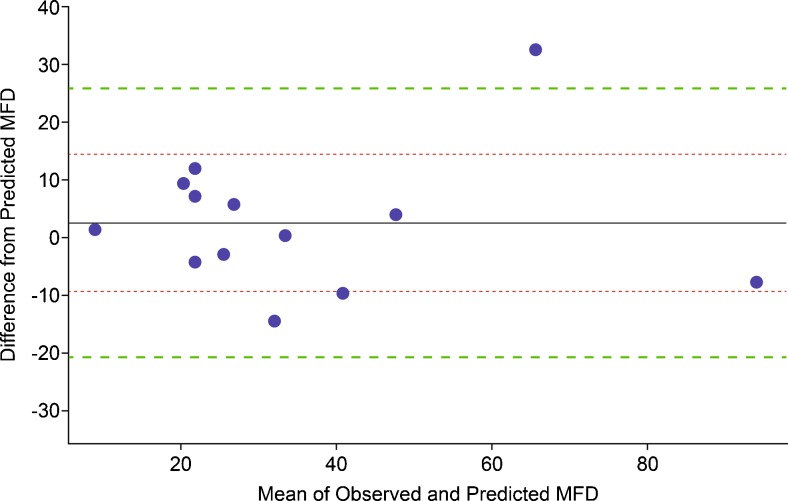
Fig. 4.
Bland-Altman Plot – the x –axis represents means (i.e., half the sum of observed and predicted MFD values); the y – axis represents the differences (i.e., predicted MFD values subtracted form observed values). The solid horizontal line is the mean difference (2.6 NGFs) for our data (n = 13) which have coefficient of determination r2 = 0.003 (95 % CI 0.000–0.038), showing no trend between means and differences. The inner dotted horizontal lines are at one standard deviation (11.9 NGFs) from the mean difference; the outer dotted lines are at 1.96 standard deviations (23.3 NGFs). About 68 % of observations will have a difference in MFD between the inner limits of agreement; about 95 % of observations will have a difference in MFD between the outer limits of agreement

