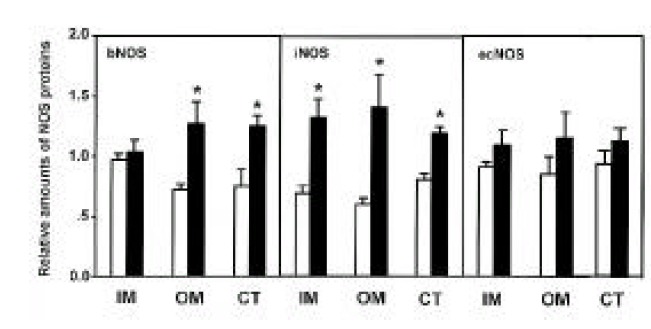
Fig. 4.

Densitometric analysis of bNOS, iNOS, and ecNOS in inner medulla (IM), outer medulla (OM) and cortex (CT) of the kidney. Open column indicates WKY rats and hatched column indicates SHR. Each point represents mean±SEM from 6 experiments. *p<0.01, compared with control.
