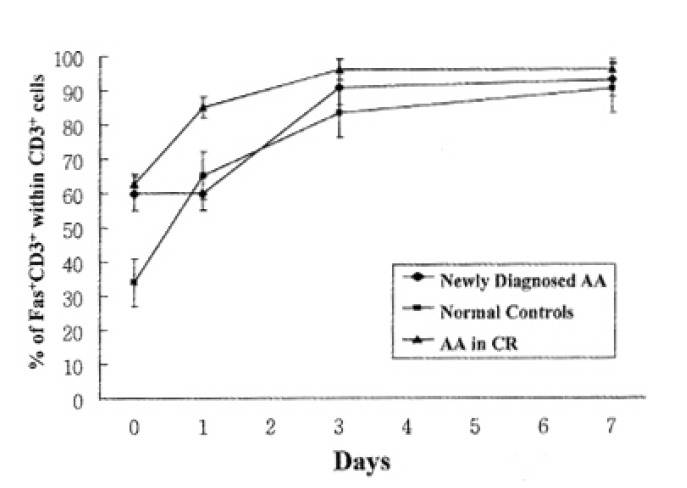
Fig. 4.

Time course kinetics of anti-fas antibody sensitivity at day 3 of activated lymphocytes. Data are expressed as absorbance (mU) difference of T lymphocytes death between activation only and anti-Fas antibody treatment at indicated time points.
