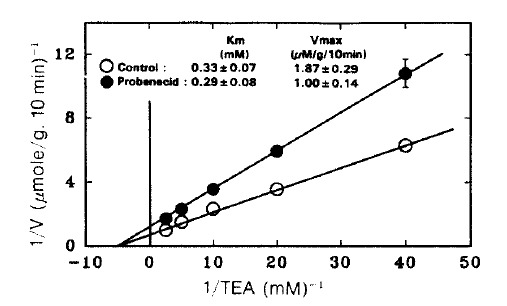
Fig. 4.

Lineweaver-Burk plot of the initial rate of active TEA accumulation into renal cortical slices in the presence and absence of 3 mM probenecid. TEA accumulation was determined during a 10-min incubation in a medium containing various concentrations of PAH and was corrected for passive accumulation which was determined in the presence of 10 mM choline chloride under 100% N2 atmosphere. Each point represents the mean ± SE of four experiments.
