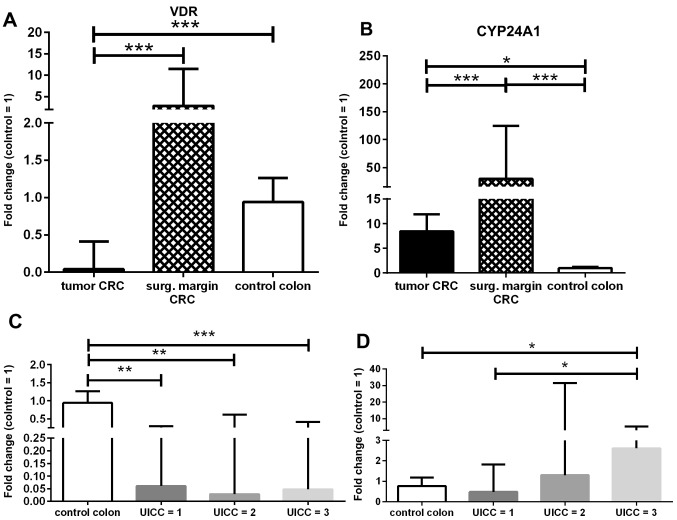
Figure 6.
Analysis of VDR and CYP24A1 expression at the mRNA level in clinical samples. Boxes represent median values; (A) VDR and (B) CYP24A1 levels in tumor CRC (black bars) and surgical margin samples (chequered bars) from 20 CRC patients were compared to colon samples from control patients (white bars, set to 1). CRC samples were divided by UICC grades (Union for International Cancer Control) for comparison to control samples for (C) VDR and (D) CYP24A1. Mann-Whitney U tests were applied; significance level, indicated by horizontal lines: *P<0.05, **P<0.01, ***P<0.001.

