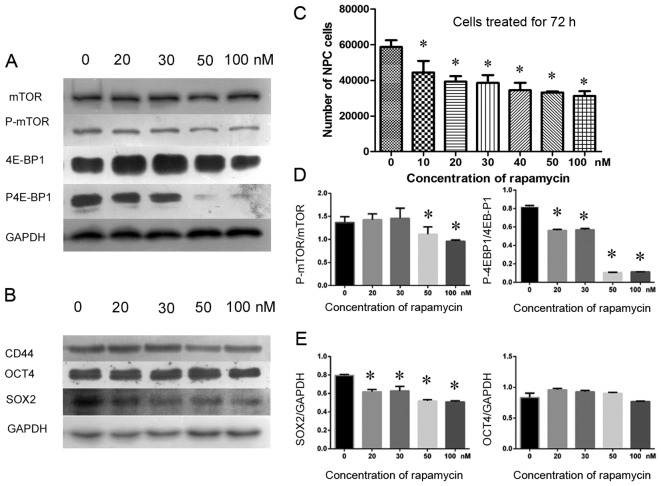
Figure 4.
Rapamycin inhibited cell growth by inhibiting mTOR signaling in cultured primary NPC cells as detected by CCK-8 assay and western blotting. CD44 and SOX2 were suppressed by rapamycin treatment, whereas OCT4 was less affected. (A) P-mTOR and a downstream effector, the phosphorylated 4E-BP1 protein (P-4E-BP1, active 4E-BP1), were gradually suppressed as the concentration of rapamycin increased (from 20 to 100 nM). In contrast, total mTOR and 4E-BP1 were not significantly affected in cultured primary NPC cells. (B) Various concentrations of rapamycin inhibited CD44 and SOX2, but OCT4 was rarely affected. (C) The number of NPC cells decreased gradually as the dose of rapamycin (from 10 to 100 nM) increased, demonstrating that NPC cell growth was inhibited by rapamycin. (D) The relative gray value ratios of P-mTOR to mTOR and P-4E-BP1 to 4E-BP1 at various concentrations of rapamycin, in which higher concentrations of rapamycin inhibited mTOR signaling more prominently compared to the normal control group (0 nM). (E) The relative expression levels of SOX2 to GAPDH and OCT4 to GAPDH, in which SOX2 was differentially inhibited by various concentrations of rapamycin, whereas OCT4 was not suppressed in cultured primary NPC cells. *P<0.05.

