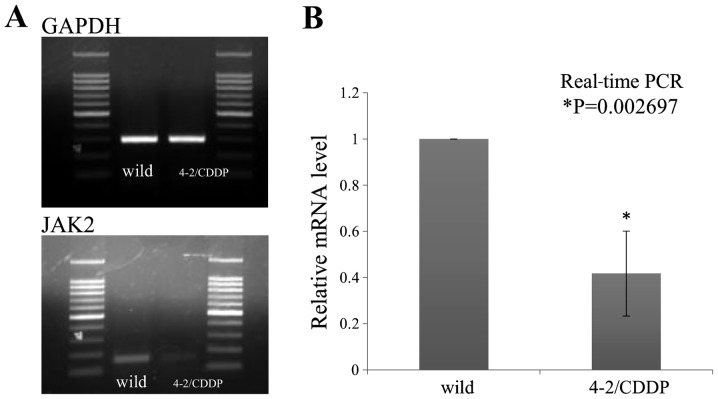
Figure 6.
(A) Comparison of JAK2 mRNA levels in wild-type and TE4-2 cells using agarose gel electrophoresis. (B) Bar graph demonstrating a comparison of JAK2 mRNA levels in wild-type and TE4-2 cells. The analyzed mPCR level of JAK2 was significantly lower in the TE4-2 cells compared with the wild-type cells (P=0.002697).

