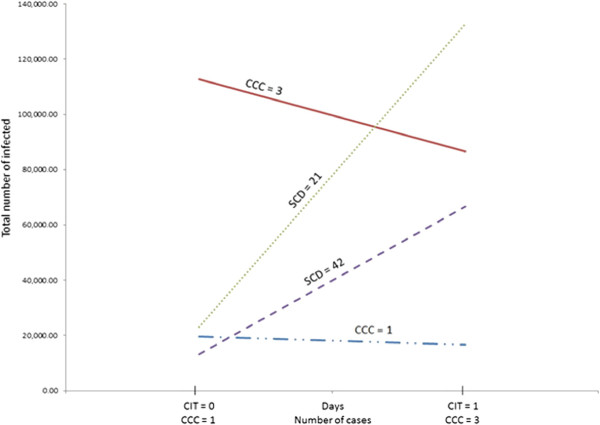
Figure 4.

Interaction effects from the 2-level experiment for the low transmissibility scenario. Graphical representation of the interaction effects on the total number of infected for CCCxCIT and SCD x CCC obtained from the 2-level experiment for the low transmissibility scenario (CCC - cases to cose a classroom; SCD - school closure duration).
