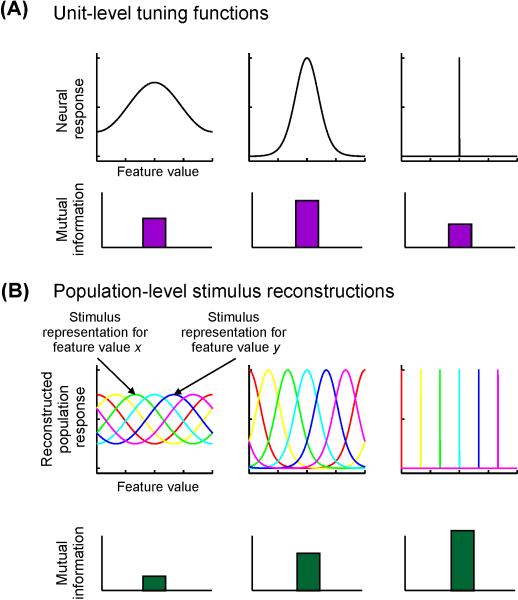
Figure 3. Information content of units and populations.
(A) As described in Box 1, the mutual information (MI) between a unit’s response strength and the associated stimulus value is a non-monotonic function of its tuning bandwidth. A non-selective unit will have very low MI (as a result of little variability in response associated with variability in the stimulus feature), but so will a highly selective unit, because it has lower overall entropy. The particular selectivity bandwidth for which a unit has greatest MI about a stimulus feature depends on the shape of the tuning function (TF), noise properties, and the relative frequency of occurrence of different feature values. (B) In contrast, for population-level stimulus reconstructions, a narrower reconstructed stimulus representation is more informative, as it reflects a greater level of discriminability between different stimulus feature values. Plotted are cartoon reconstructions of different values of a stimulus. Each color corresponds to a different feature value, and each point along each curve corresponds to the reconstructed activation of the corresponding population response (as in Figs. 2 D-E).

