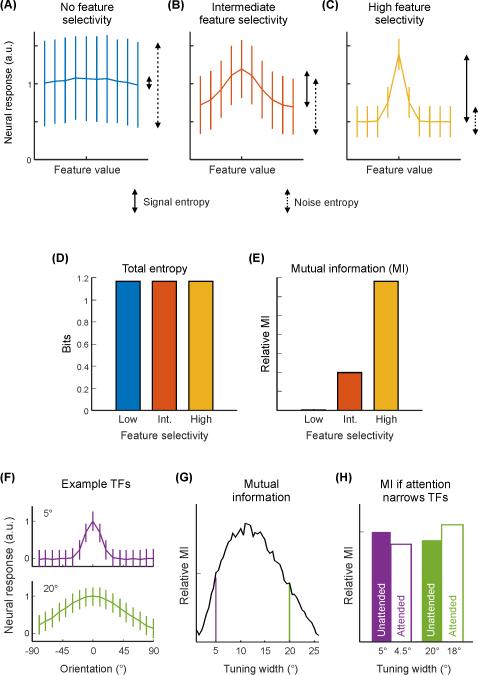
Figure I. Comparison of unit-level information content (mutual information).
For a cartoon neural tuning function (TF; measured in arbitrary units, a. u.) with no (A), intermediate (B) or high (C) feature selectivity, the overall entropy of the neural response (given equal stimulus probability) is the same (D) but the mutual information (MI) between the neural response and the feature value (E) is much higher when the neuron exhibits selectivity (e.g., C) than when it is non-selective (e.g., A), with intermediate selectivity (e.g., B) falling in between. In cases where attention narrows the selectivity of a unit, whether such a change results in improved information content depends on the original selectivity before narrowing [127,128]. (F) Cartoon of neural TFs for stimulus orientation with different tuning widths (top: narrow tuning width/high selectivity; bottom: large tuning width/low selectivity). (G) When MI is plotted as a function of tuning width, any changes in tuning width that are associated with attention can either increase or decrease MI depending on the original tuning width. Vertical lines indicate tuning width values of example TFs in (F). (H) For a modest attention-related narrowing in tuning (e.g. ~10% reduction in tuning width), a unit with a small tuning width may actually carry less information with attention, while a unit with a large tuning width would carry more information. Note: panels F-H do not equate total entropy across tuning widths (as in panels A-C), accounting for differences in MI plots between panel E and panels G-H.

