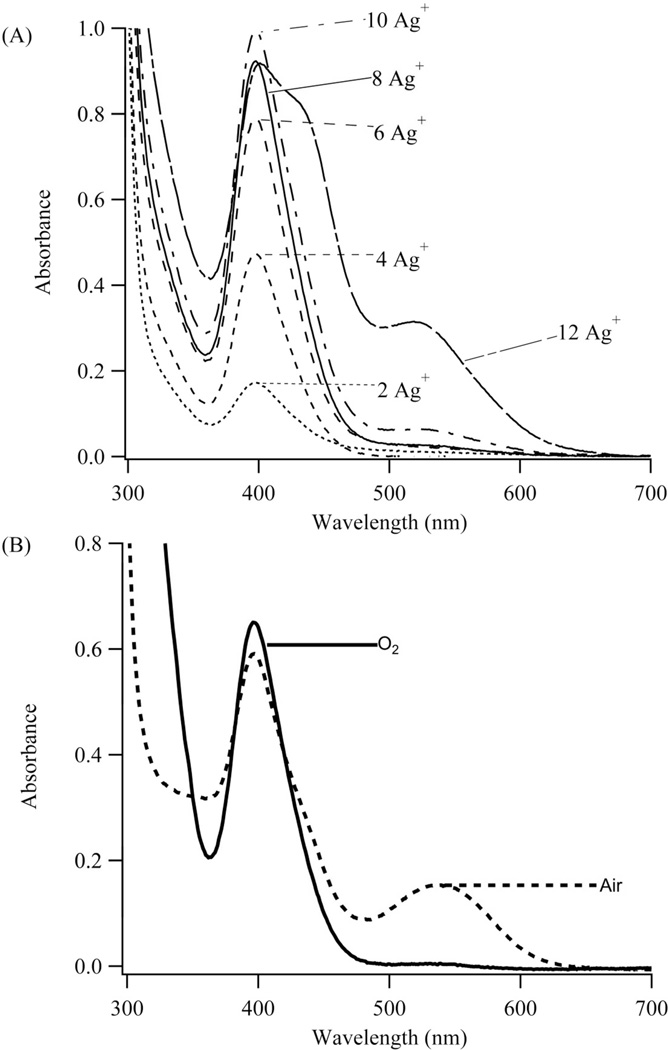
Figure 2. Cluster Synthesis.
(A) Absorption spectra of 45 µM S1-S212a with varying amounts of Ag+. In relation to the oligonucleotide concentration, the relative concentrations are 2 Ag+, 4 Ag+, 6 Ag+, 8 Ag+, 10 Ag+, and 12 Ag+. Up to 8 Ag+, absorption increases at 400 nm, which supports population of a specific cluster binding site. Beyond 8Ag+, new species with longer wavelength absorbances develop. (B) Absorption spectra of 30 µM S1-S212a with 8 Ag+ and 4 BH4- acquired with exposure to oxygen (solid line) and to air (dashed line). Oxygen eliminates alternate species and favors the violet absorbing species.

