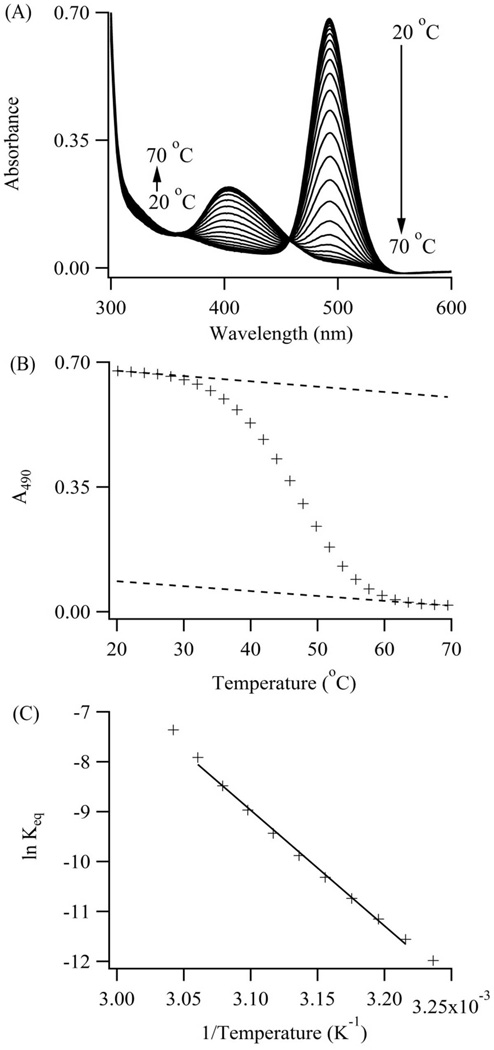
Figure 5. Cluster-DNA Equilibrium.
(A) Higher temperatures favor the violet over the blue-green absorption. An isosbestic point develops between the absorption bands and supports direct conversion of the violet to the blue-green conjugate via the complement S2C12c. (B) Blue-green cluster absorbances at 490 nm were extracted from the spectra and track the reaction progress. Extrapolated upper and lower baselines (dotted lines) define the reactant and product states over the full temperature range. These baselines yield fractional conversion of the blue-green conjugates and equilibrium constants for its dissociation. (C) A van’t Hoff representation for dissociation of the blue-green conjugate with S1-S212c:S2C12c yields the enthalpy and entropy changes for denaturation and hence cluster transformation.

