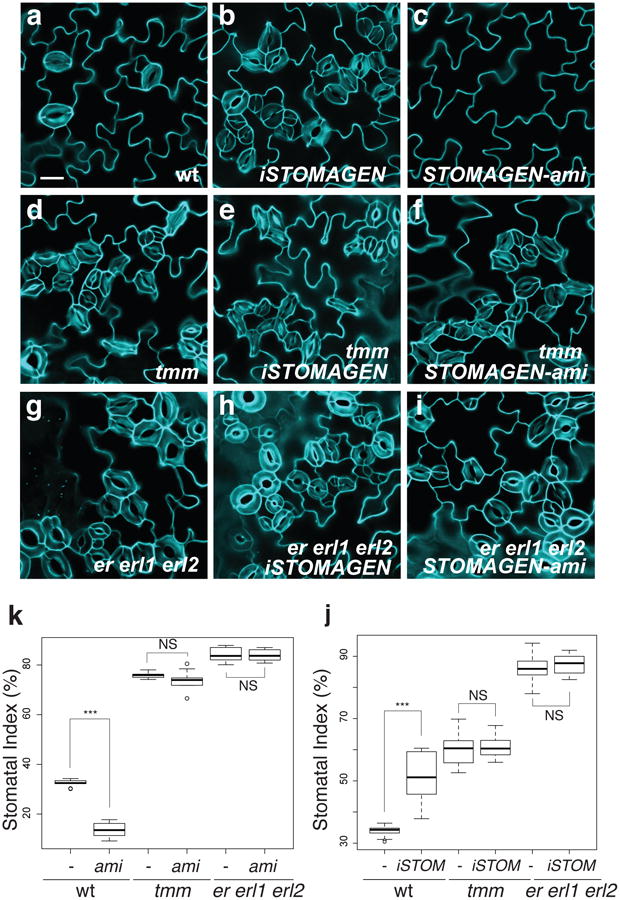
Fig. 1. Complete loss of ER-family genes confers insensitivity to STOMAGEN overexpression and co-suppression.

(a-i) Representative confocal images of cotyledon abaxial epidermis from 10-day-old light grown seedlings of wild type (a-c), tmm (d-f), and er erl1 erl2 (g-i), with induced Stomagen overexpression (iSTOMAGEN,)(b, e, h) or STOMAGEN-ami construct (c, f, i). Uninduced controls show no effects (see Extended Data Figs. 2-4). Images were taken under the same magnification. Scale bar = 30 μm. n=13 (a); n=18 (b); n=26 (c); n=16 (d); n=24 (e); n=26 (f); n=16 (g); n=24 (h); n=12 (i). (j) Stomatal index. -, control; ami, Stomagen-ami. *** p<0.005 (Wilcoxon rank sum test). NS=Not significant (p= 0.653 for tmm; p=0.539 for er erl1 erl2). n=8 for each genotype. (k) Stomatal Index. -, uninduced; iSTOM, induced. *** p<0.005 (Wilcoxon rank sum test). NS=Not significant (p= 0.114 for tmm; p=0.688 for er erl1 erl2). No induction, n=16; iSTOM, n=14; tmm no induction, tmm iSTOM, er erl1 erl2, er erl1 erl2 iSTOM, n=15 for each genotype. For the total numbers of stomata counted, see legends for Extended Data Figs. 3 and 4.
