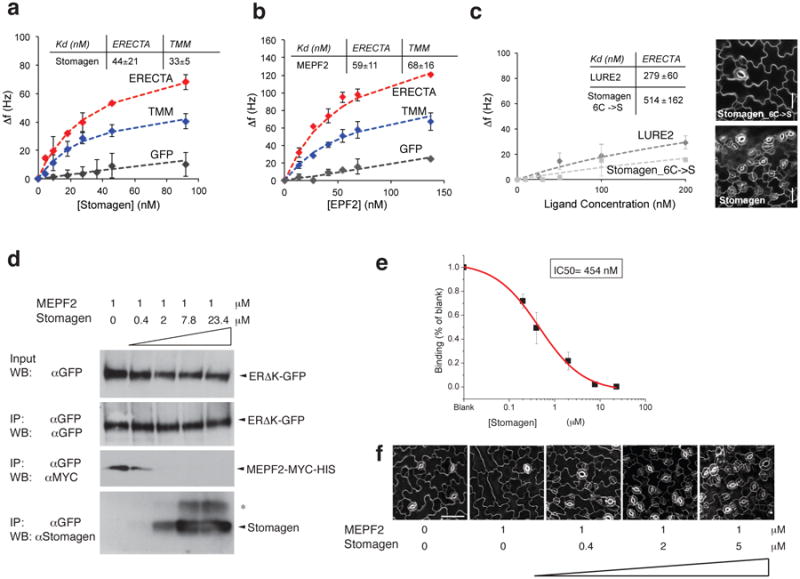
Fig. 3. Direct and competitive binding of Stomagen and EPF2 peptides to ER.

(a-c) QCM analysis for direct binding. (a, b) The averages of experimental frequency shift values recorded from two to four independent experiments for Stomagen (a) or MEPF2 (b) onto biosensor chips functionalized with ERΔK-GFP (red), TMM-GFP (blue), and GFP alone (gray) and fitted to the Langmuir adsorption model using least square regression. Error bars, SD. Stomagen/ER, n=4; Stomagen/TMM, n=2; Stomagen/GFP, n=3; MEPF2/ER, n=2; MEPF2/TMM, n=3; MEPF2/GFP, n=2. (c) The average experimental frequency shift values recorded for LURE2 (dark gray) and mutant Stomagen (light gray) on ERΔK-GFP. To calculate the Kd values, the ligand concentrations were increased to 1μM to obtain fitted curves. See Extended 9 for raw recording data. Stomagen_C6->S/ER, n=3; LURE2/ER: n=2. Right Insets: Wild-type cotyledon epidermis treated with 2.5 μM mutant or bioactive Stomagen. Scale bars, 30 μm. n=8 for each treatment. For (a-c), each QCM experiment (referred to as ‘n=1′) generates multi-point (10-20 point) data with average and SD values. (d) Competitive binding. Microsomal fractions expressing ERΔK-GFP were incubated with 1 μM of bioactive MEPF2 with increasing concentrations of bioactive Stomagen and subjected to IP. The MEPF2-MYC-HIS blot was re-probed with anti-Stomagen antibody. *, Most likely isomer. (e) Quantitative analysis of competition from four biological replicates. Error bars, S.E.M. The IC50 value is substantially higher than the Kd values for Stomagen-ER or Stomagen, presumably owing to the immunoblot-based quantification. (f) Wild-type cotyledon epidermis treated with MEPF2 alone or simultaneously co-treated with MEPF2 and increasing concentrations of Stomagen for five days. n=3 for each treatment. Images were taken under the same magnification. Scale bar, 50 μM.
