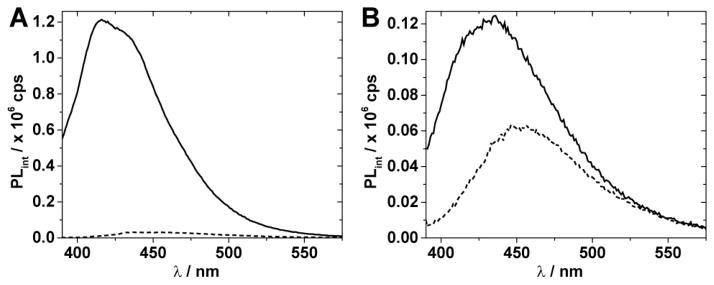
Figure 4.

Emission spectra of 1 μM GluR B R/G site single stranded RNA (A) and duplex RNA (B) with incorporated thA (solid line), and thI (dashed line) in ADAR2 buffer at 30 °C containing DTT (0.5 mM), yeast tRNA (1 μg/μL), and RNasin (0.16 U/μL). Spectra were recorded on a Horiba Fluoromax-3 after excitation at 380 nm using slit-widths of 5 nm. Spectra are corrected for the blank fluorescence signal measured using the same instrument settings.
