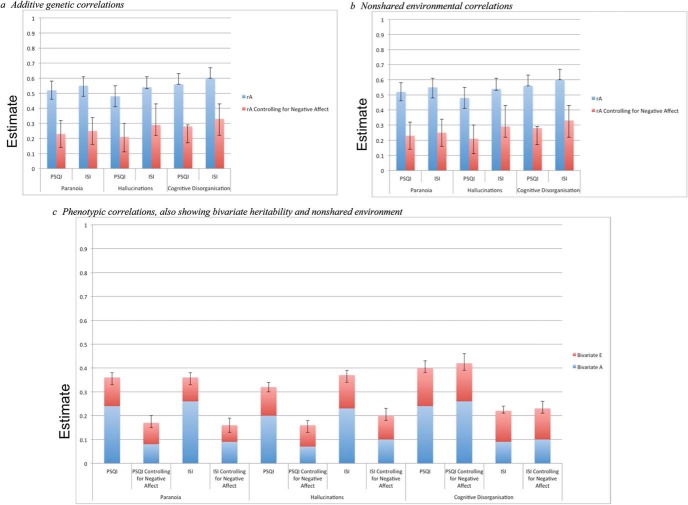
Figure 1.
Graphs showing etiological and phenotypic correlations before and after controlling for negative affect: (a) additive genetic correlations, (b) nonshared environmental correlations, (c) phenotypic correlations, also showing bivariate heritability and nonshared environment. PSQI = Pittsburgh Sleep Quality Index; ISI = Insomnia Severity Index. See the online article for the color version of this figure.

