


Fig. 2.
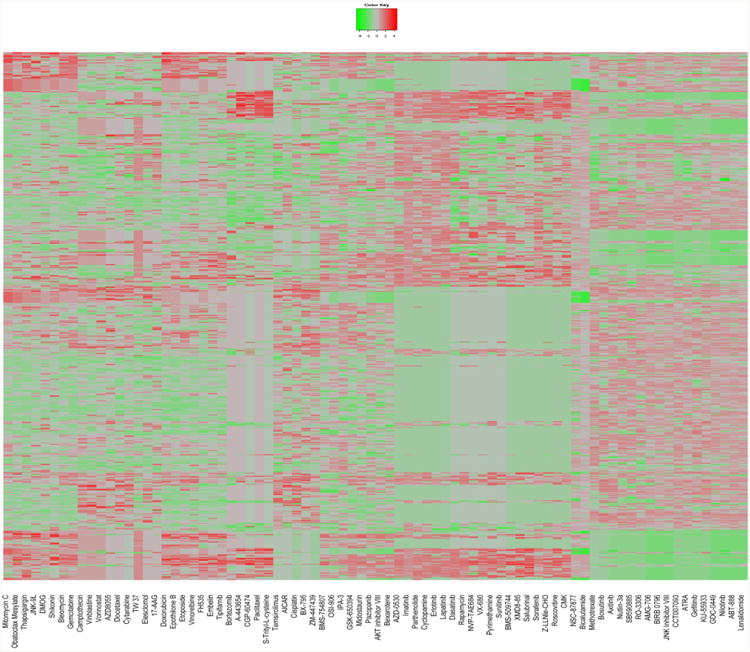
Heatmap for normalized IC50 values of 75 drugs (columns) on 624 cell lines (rows). Green means the most sensitive, red means the most resistant.
Official websites use .gov
A
.gov website belongs to an official
government organization in the United States.
Secure .gov websites use HTTPS
A lock (
) or https:// means you've safely
connected to the .gov website. Share sensitive
information only on official, secure websites.
Heatmap for normalized IC50 values of 75 drugs (columns) on 624 cell lines (rows). Green means the most sensitive, red means the most resistant.