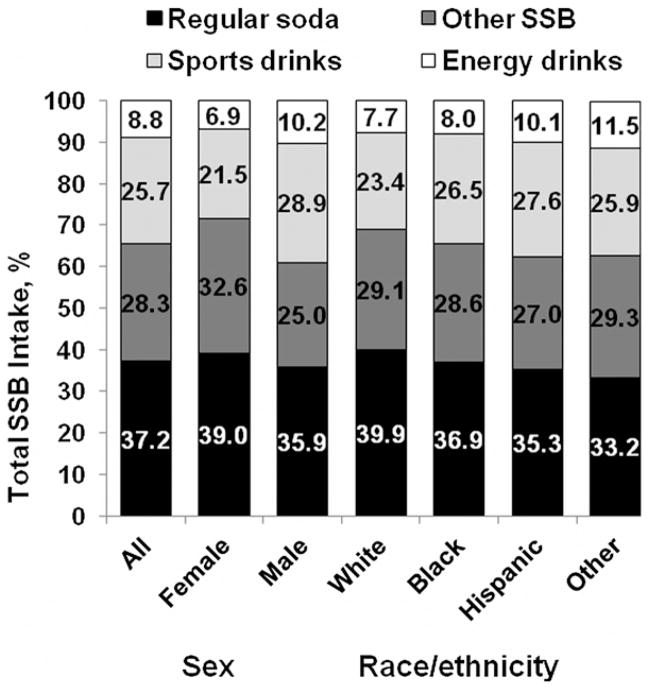
FIGURE 1.
The relative contribution of various beverages to the total number of times SSB were consumed for all respondents (n = 11,029) according to sex (n = 10,976) and race/ethnicity (n = 10,817) among US high school students who reported consuming any SSB during the past 7 d (NYPANS, 2010). NYPANS, National Youth Physical Activity and Nutrition Study; SSB, sugar-sweetened beverage.

