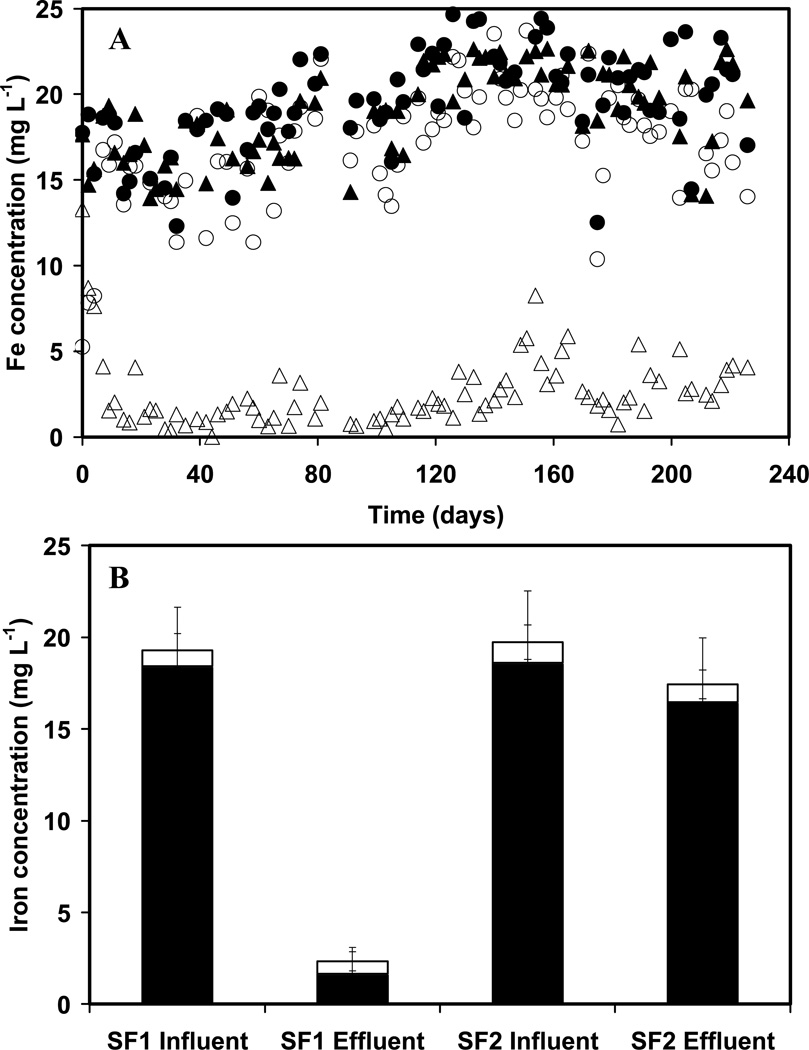
Figure 1.
Panel A, concentrations of soluble total Fe in the influent and effluent of biological column SF1 as a function of time: Column SF1 (fed with 360 μM Fe(II), 6.67 μM As(III) and 2.5 mM nitrate): (▲) influent, (Δ) effluent; Column SF2 (fed with 360 μM Fe(II) and 6.67 μM As(III) without nitrate): (●) influent, (○) effluent; panel B, iron speciation in the influent and effluent of sand packed columns SFF1 or SF2: Fe(II) (solid bars) and Fe(III) (empty bars).

