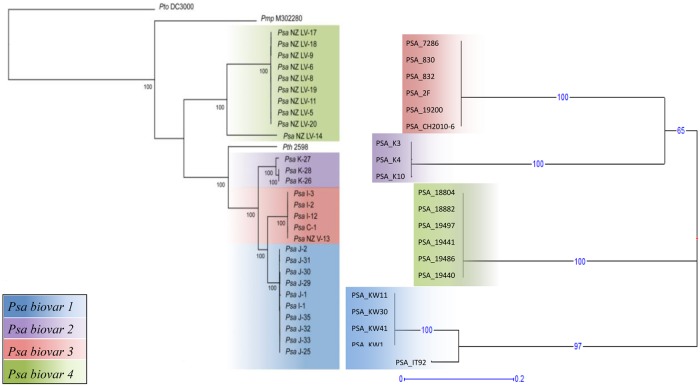
Fig 1. Comparison of dendrograms obtained by SNPs and MLVA analysis.
The dendrogram on the left was obtained by Maximum Likelihood analysis on 15,329 SNPs from WGS sequences of 28 Psa strains [37], whilst the radial dendrogram on the right was obtained by Unweighted Neighbor Joining tree from six selected VNTR loci (Panel 1) on 20 strains used in this study selected for having geographical and time origins identical or corresponding to the first ones. Numbers on branches represents the percentage of bootstraps on 500 replications.

