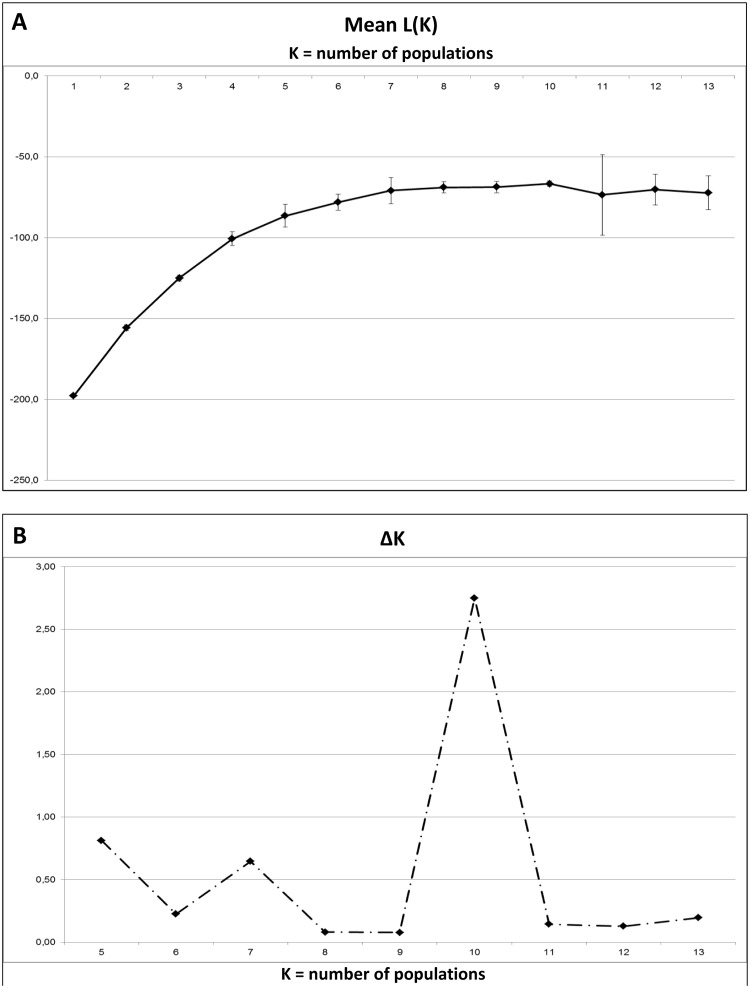
Fig 2. Graphical representation of the main steps to infer the number of populations K.
Results obtained by STRUCTURE 2.3.4. (A) Mean L(K) ± SD over 20 runs for each K value. A hierarchical island model was applied on all the 142 strains and the six VNTR loci constituting Panel 1. (B) ΔK = m|L”(K)|/s[L(K)] gives the modal value of the distribution that represents the suggested number of subpopulations among the examined strains, here ten groups.

