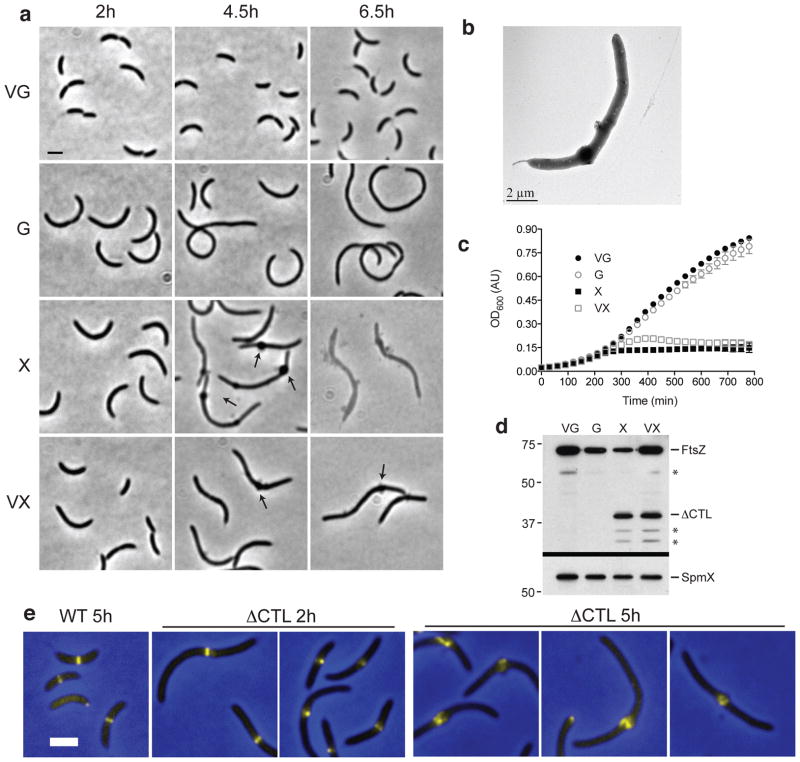
Figure 3. ΔCTL production causes dominant lethal envelope bulging and cell lysis.
(a) Phase contrast images of cells from strain EG852, with vanillate-induced expression of ftsZ and xylose-induced expression of ΔCTL. Cells were grown for the indicated amount of time in PYE medium with the indicated inducer (vanillate (V), xylose (X), and/or glucose (G)) prior to imaging. Arrows highlight envelope bulges. Bar = 2 μm. (b) Whole mount transmission electron micrograph of an EG852 cell grown in PYE xylose for 4 h. (c) Growth of strain EG852 in PYE with the indicated inducers added at time 0, as monitored by OD600. Average ± standard deviation (s.d.) from three technical replicates is plotted. (d) Immunoblot of lysates from cells in (a) after 7 h growth in PYE with the indicated inducers using FtsZ (top) or SpmX antisera (bottom). Asterisks indicate degradation products. Positions of molecular weight markers (kDa) are indicated (left). (e) Merged ZapA-Venus fluorescence (yellow) and phase contrast (blue) images of cells producing WT FtsZ (EG1396) for 5 h or ΔCTL (EG950) for 2 h or 5 h.

