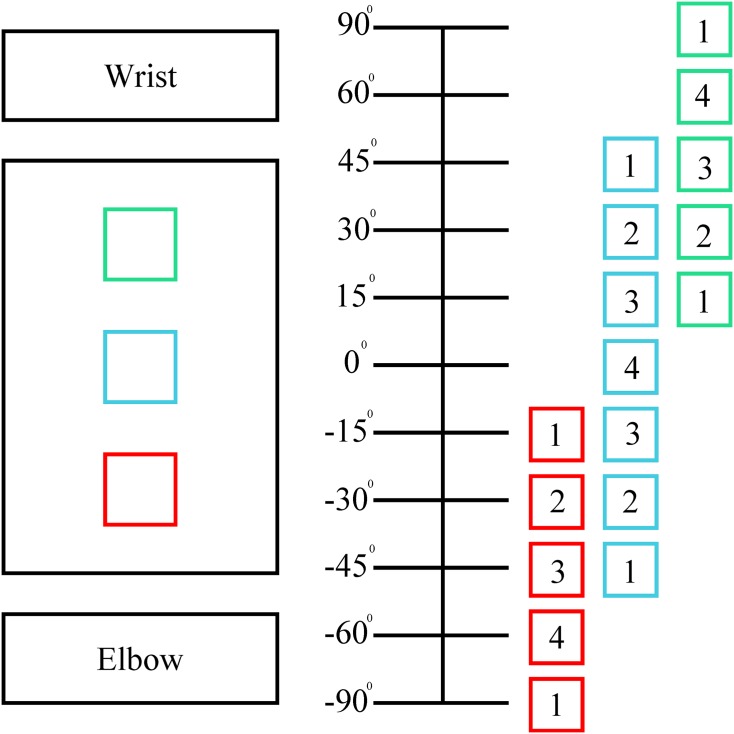
Fig 4. Feedback schematic presented to participants.
The green, blue, and red boxes to the left of the angle marking line show the positions of the tactors on the forearm. The boxes to the right of the line show the frequency amplitude (values in Table 1) of the tactors at a given virtual wrist position.

