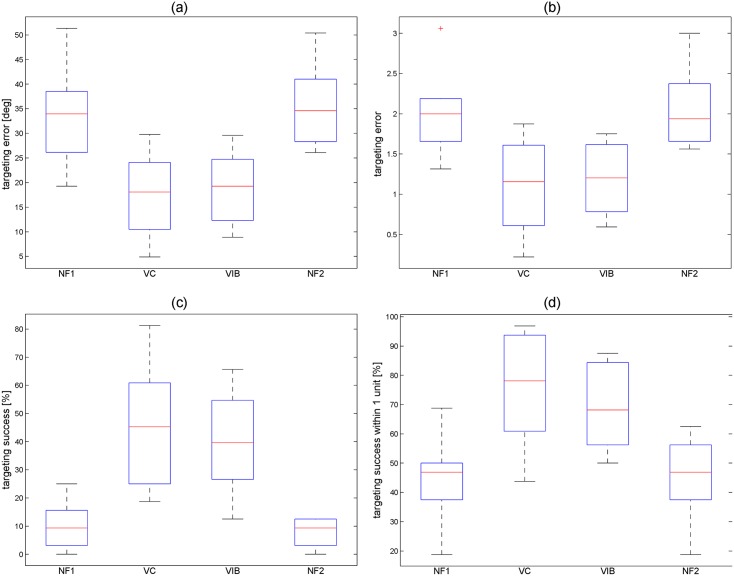
Fig 6. (a) Box plots of participants’ mean continuous targeting errors, (b) mean discretized targeting errors, (c) success in reaching the target and (d) near success in reaching the target for the No Feedback #1 (NF1), Voice Coil (VC) Feedback, Vibrotactile (VIB) Feedback, and No Feedback #2 (NF2) cases.
The solid line in the boxes shows the median and the edges of the boxes are the 25th and 75th percentiles. The whiskers extending from the boxes show the most extreme data not considered to be outliers (within ±2.7σ) and “+” markers denote outliers.

