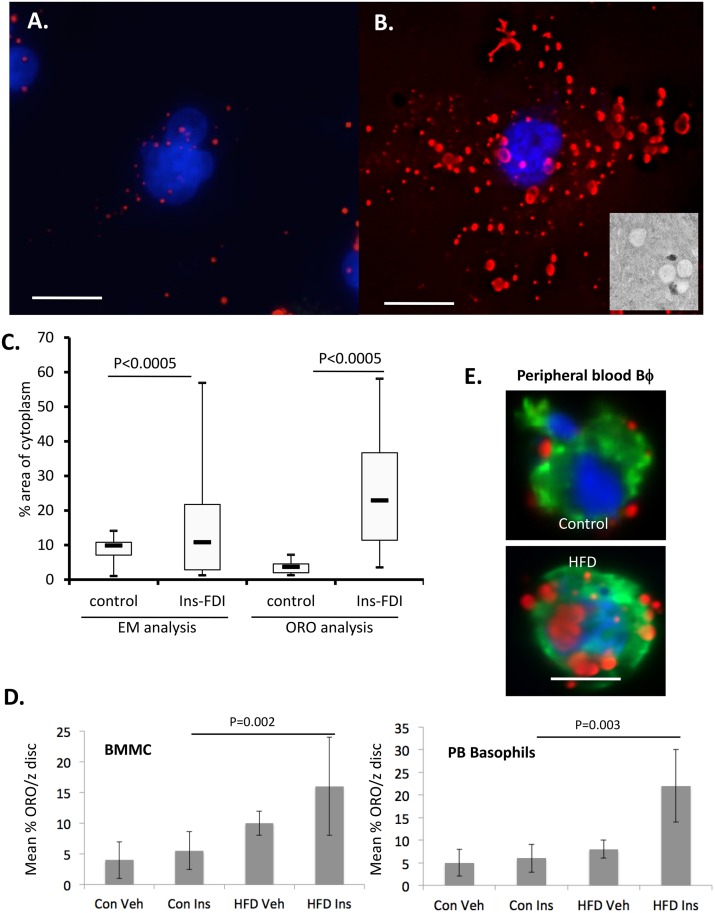
Fig 1. Lipid body induction in vitro and in vivo by insulin.
A, B. Fluorescent visualization of lipid bodies using Oil Red O (ORO, 0.35% w/v) counterstained with DAPI in PFA-fixed RBL2H3 cells either untreated (A) or treated with 0.01 mg/ml insulin for 6d (B). Deconvolved z stacks were projected as an extended depth of focus (EDF) image using Nikon NIS Elements. Scale bars are 5 microns. B. inset. 120,000x electron micrograph image of LB structures from 6d insulin-treated cell. C. Area measurement of insulin-induced cytosolic structures were assessed by analyses of EM micrographs (NIH Image J, n = 12) or binary threshold analysis of 25 whole cell ROI for ORO. The whole cell area was determined using a WGA membrane stain and % area of cytoplasm was calculated. The average of the calculations (n = 12 cells for EM analysis and n = 25 cells for fluorescence analysis) are plotted. D. ORO assessment of LB numbers in BMMC from normal and HFD-maintained mice. BMMC were prepared as described and maintained for 6d in 200 ng/ml insulin. Z discs (n = 25 z discs from 6 cells) were assessed for ORO stained area and data are expressed as mean % of the z disc (ROI determined by WGA staining for cell boundaries) that was ORO positive. E. Murine peripheral blood basophils were isolated using MACS, fixed and stained for LB content as described. Counterstains are DAPI and WGA. 3D rendered images (upper panels) were used to calculate cell volume and the % of cytoplasm (lower panel) occupied by ORO-positive structures. Con, control; Veh, Vehicle; Ins, Insulin. Veh samples are n of only 1, and are shown for comparison purposes only.

