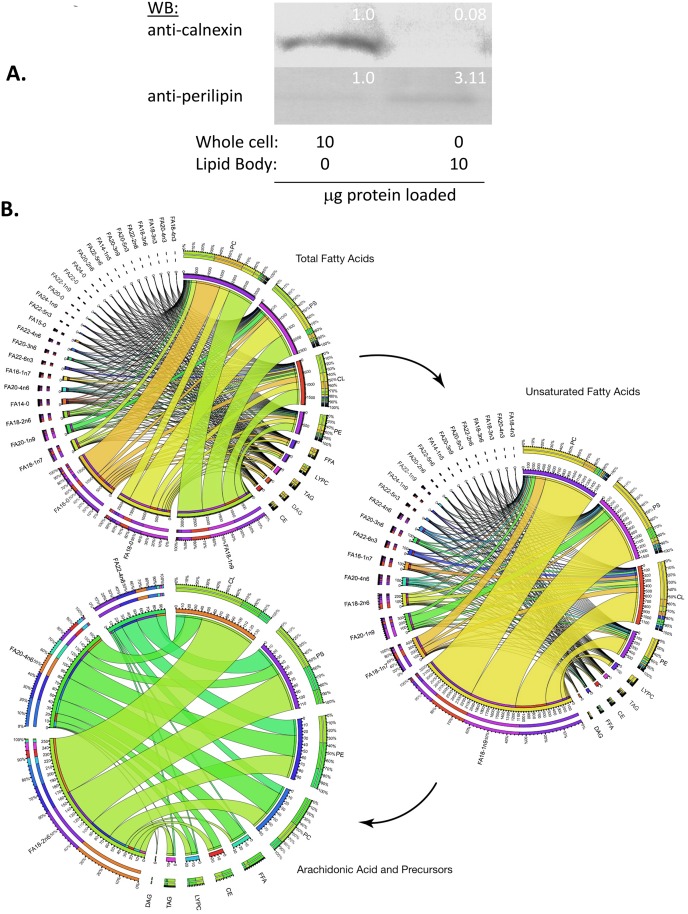
Fig 3. Lipidome of lipid bodies isolated from insulin-exposed RBL2H3.
RBL2H3 were grown for 6d with insulin-FDI and LB were isolated by ultracentrifugation. A. Confirmation of LB enrichment in ultracentrifugation fractions. Fractions were Western blotted for the enriched presence of the LB-associated protein perilipin A and the diminished representation of the ER-resident chaperone calnexin. Each lane resolves 10 μl of whole cell or LB protein determined by BCA assay. Inset numbers represent ratio of expression determined by integrated density of the Western band (Image J). B. Lipid profile of isolated LB. Individual major lipid classes were separated by high performance liquid chromatography (HPLC) and fatty acid methyl esters from each class were produced and subsequently analyzed by GC/MS. Abundance of lipid species in LB from insulin-FDI treated mast cells were quantified and organized into ribbon plots using Circos. All lipid species and nmole percentage representations of the observed classes are visualized. The Circos plots draw ribbons from the fatty acids to the different associated classes. Line width is proportional to the recorded percentage. The outer ring is representative of the total nmole percentage of either the fatty acid and/or class. The inner ring is the relative amount of each element in the plot. The values listed on the inner ring are 100x larger than the percentage in order to resolve less common fatty acids. The three different plots reduce the information from the total fatty acids (top) to the unsaturated fatty acids (middle) to arachidonic acid and its precursors (bottom). This Fig resolves which lipid class and at what percentage each arachidonic acid pathway member occurs.

