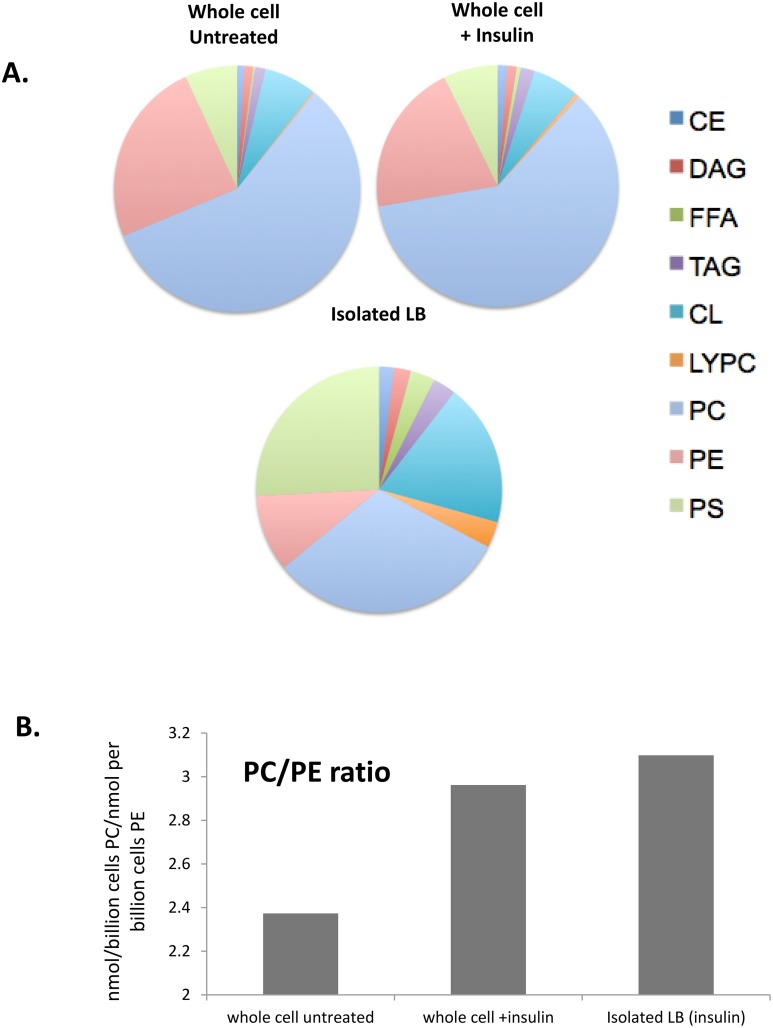
Fig 5. Representation of lipid species in isolated LB and whole cell lipidomes.
A. Comparison of the percentage abundance of the indicated lipid classes in the whole cell extracts from untreated and insulin (6d) treated cells, and isolated LB from 6d insulin-treated cells. B. PC/PE ratio calculated for whole cell extracts from untreated and insulin (6d) treated cells, and isolated LB from 6d insulin-treated cells. Cholesterol Ester (CE), Cardiolipin (CL), Triacylglycerol (TAG), Diacylglycerol (DAG), Free Fatty Acid (FFA), Phosphatidylserine (PS), Phosphatidylcholine (PC), Phosphatidylethanolamide (PE), Lysophoshatidylcholine (LYPC).

