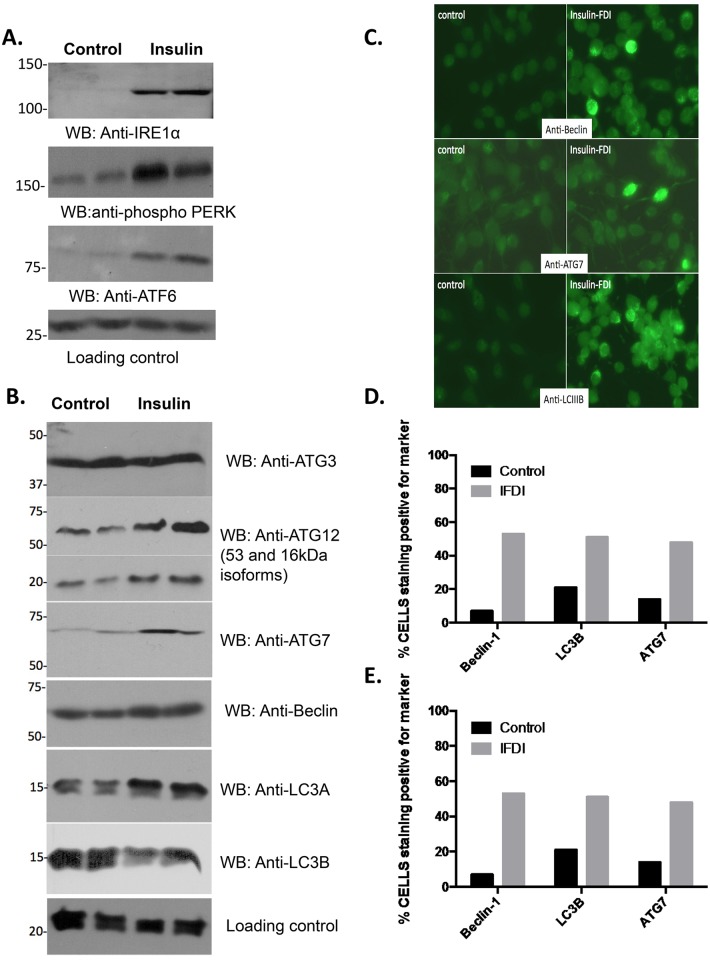
Fig 6. ER reprogramming, ER stress and autophagy in insulin-treated RBL2H3.
A, B. Altered expression of markers of ER stress, the UPR and autophagy. RBL2H3 were treated with insulin-FDI for 6d and protein lysates were prepared. Western blot analysis (antibody concentrations indicated in micrograms/ml)was performed using UPR markers anti-IRE1 alpha (0.5), anti-phospho PERK-Thr980 (0.1), anti-ATF6 (2.5) and loading control anti-GRB2 (0.05)(A) and autophagy markers (B) anti-ATG3 (0.5), anti-ATG12 (0.5), anti-ATG7 (0.5), anti-Beclin (0.5), anti-LC3A (0.1), and anti-LC3B (0.5) with anti-Grb2 as a loading control. C-E. Immunofluorescent identification and quantification of autophagy positive mast cells. Three markers of autophagy (Beclin-1, LC3B and ATG7) were used to quantify the percent of cells staining positively for autophagy (C). D, E. Quantification of autophagy marker immunostaining. Counting was performed in a sample-blinded fashion and expressed as % of 200 counted cells (D) and mean of the number of immunodecorated structures per cell (E).

