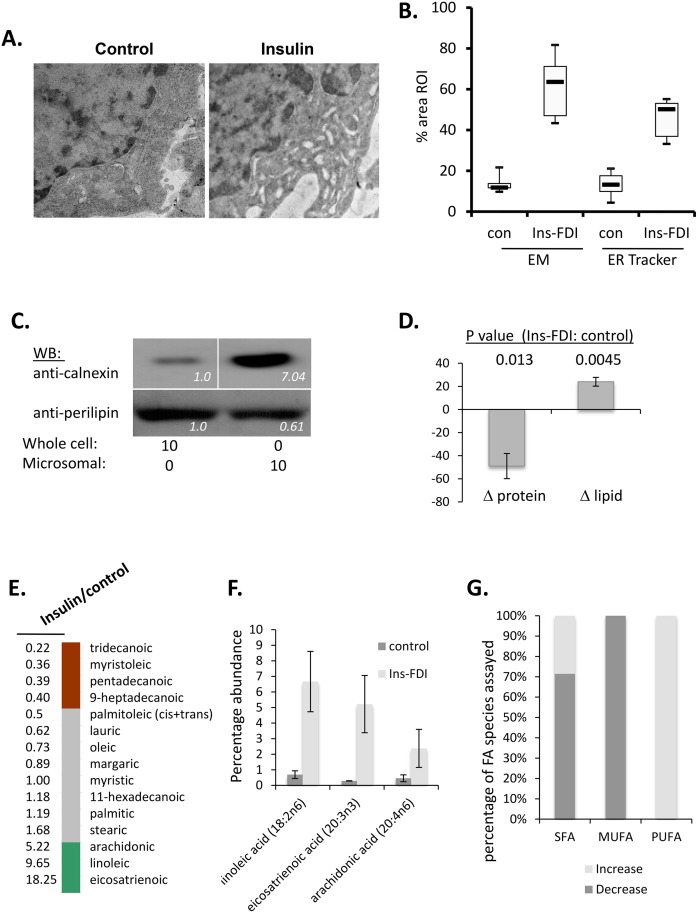
Fig 7. ER distension and lipid biogenesis in insulin-exposed RBL2H3.
A. Electron micrographs of control and insulin-FDI exposed RBL2H3 showing normal (left) and distended (right) ER. Images are digitally zoomed from 5000x original plates. B. Area analysis of ER by electron and fluorescence microscopy. Cytoplasmic (n of 20 per condition) ROI were drawn on either micrographs (Image J) or confocal images of cells stained with ER-Tracker dye (NIS Elements). Data are expressed as percentage area of ROI occupied by ER. C. Confirmation of ER enrichment in purified ER/microsomal fractions. ER/microsomal fractions were prepared by ultracentrifugation as described in Methods and Western blotted for enrichment in the ER-resident chaperone Calnexin. Relative band intensities are shown on each panel (Image J). D. Comparison of protein and lipid levels in ER/microsomal fractions prepared from control and Insulin-FDI treated RBL2H3. Total protein was assessed by BCA analysis, and total lipid content was assessed by ORO absorbance assay after Bligh-Dyer extraction. E. Characterization of ER Fatty acids. RBL2H3 were grown for 6d with insulin-FDI as described. Isolated ER was analyzed by GC/MS and variations in ER lipids versus control levels were organized by fold change (values along y-axis) and abundance. Green, > 2 fold increase in treated over controls; gray, no change; red, decrease to < 50% of control levels. F. Relative abundance of eicosatrienoic, arachidonic and linoleic acid in ER from control and Insulin-FDI treated cells. G. Summary of alterations in saturated (SFA), mono-unsaturated (MUFA) and poly-unsaturated (PUFA) fatty acids in ER/microsomal fractions from control and insulin FDI-treated cells.

