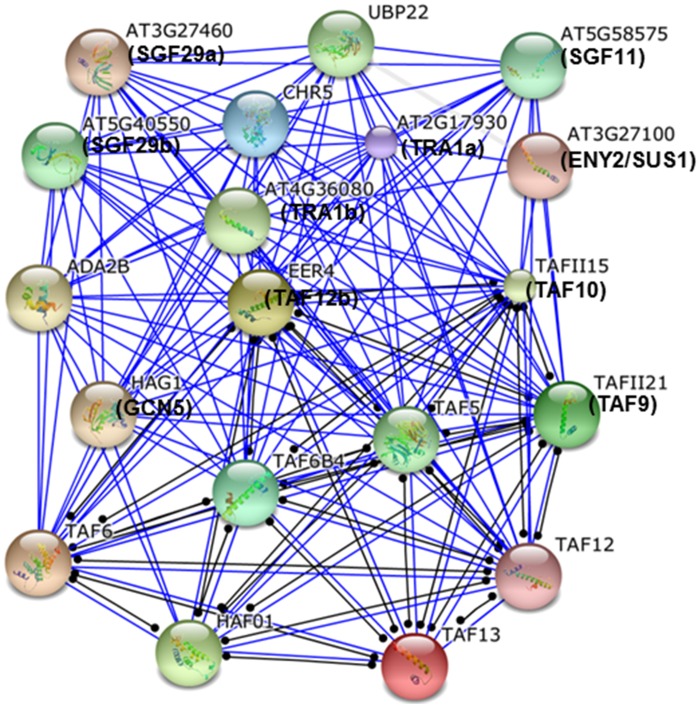
Fig 5. Interactome of the SAGA complex subunits.
SAGA complex subunits interactomes were obtained from STRING database. Interactome between the protein pair is shown.in a confidence view where associations are represented by blue and black lines. Blue lines suggested the binding and black lines suggest a reaction between the proteins. The protein-protein network among SAGA component genes was analysed with high confidence of score 0.6.

