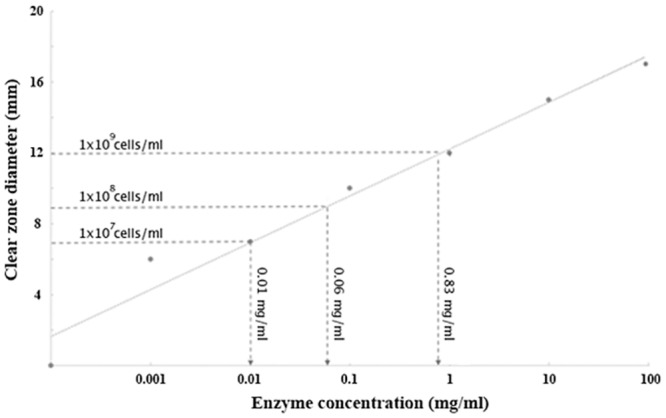
Fig 10. Linear correlation of clear zone diameters and amounts of hydrolytic enzyme used in the agar plate enzymatic assay.

Laminarin-supplemented LB agar was hydrolyzed by various concentrations of cellulase enzyme (X-axis). Resulting clear zones (Y-axis) were visualized by staining with iodine. There is a linear relationship between the amount of enzyme and the diameter of clearing when displayed on a semi-log plot. Clear zone diameters generated by various pPinsEXO1-harboring E. coli cell suspensions (horizontal dash lines) were correlated with amounts of enzyme (vertical dash lines).
