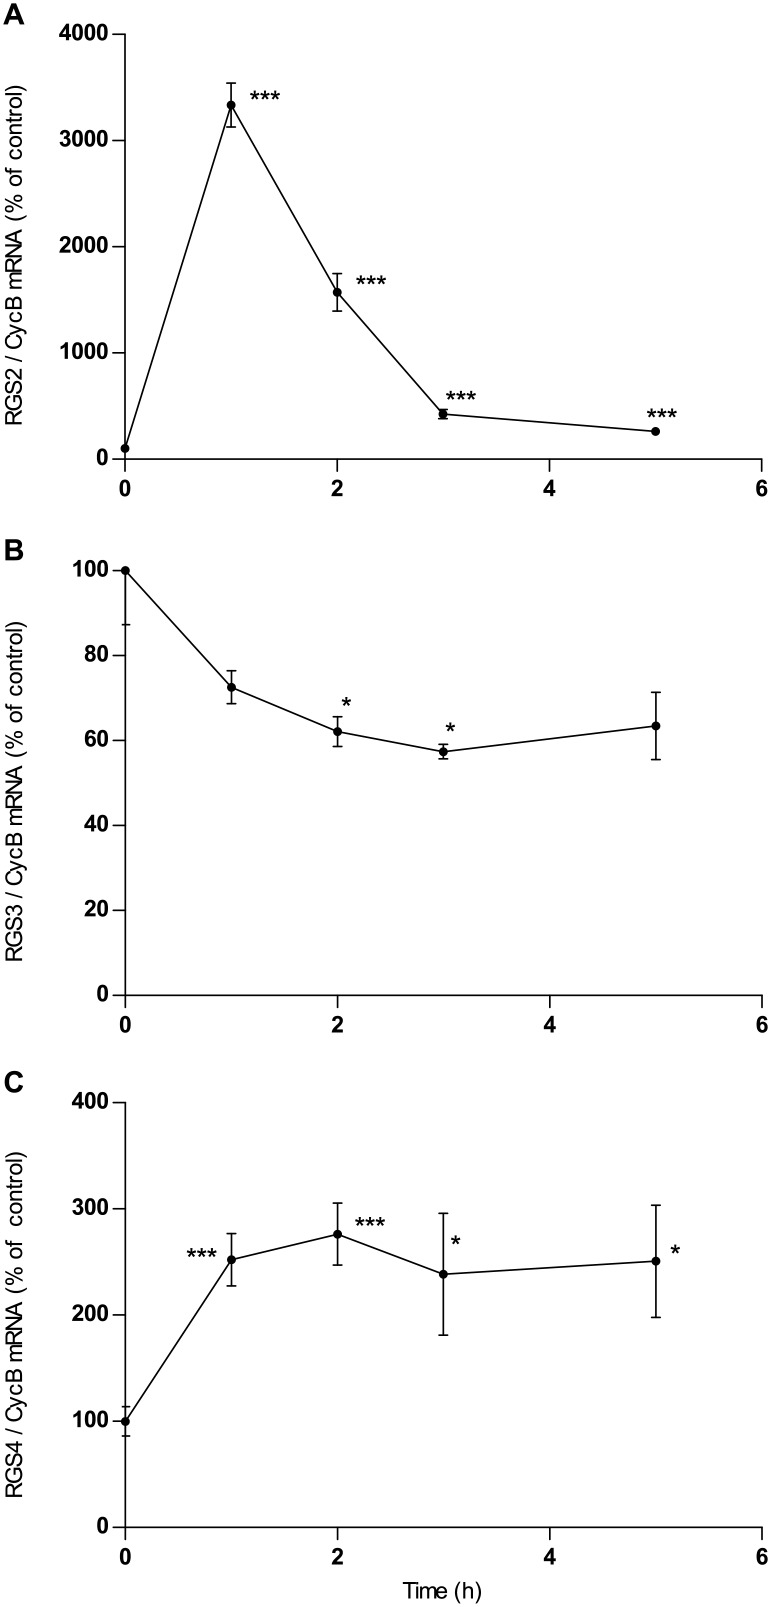
Fig 3. Time course of the effect of NECA (1μM) on the expression of mRNA of RGS2 (A), RGS3 (B) and RGS4 (C) in rat astrocytes.
Cells were cultured, incubated with NECA and assayed for mRNA expression by quantitative realtime PCR as described in Materials and Methods. Data given in A and B are means of five replica culture dishes ±SEM. Two repetitions of the experiment gave similar results. Data given in C are means of 3 different experiments done in four replica culture dishes. *p<0.05, ** p<0.01, *** p<0.001, student’s t-test, two-tailed.

