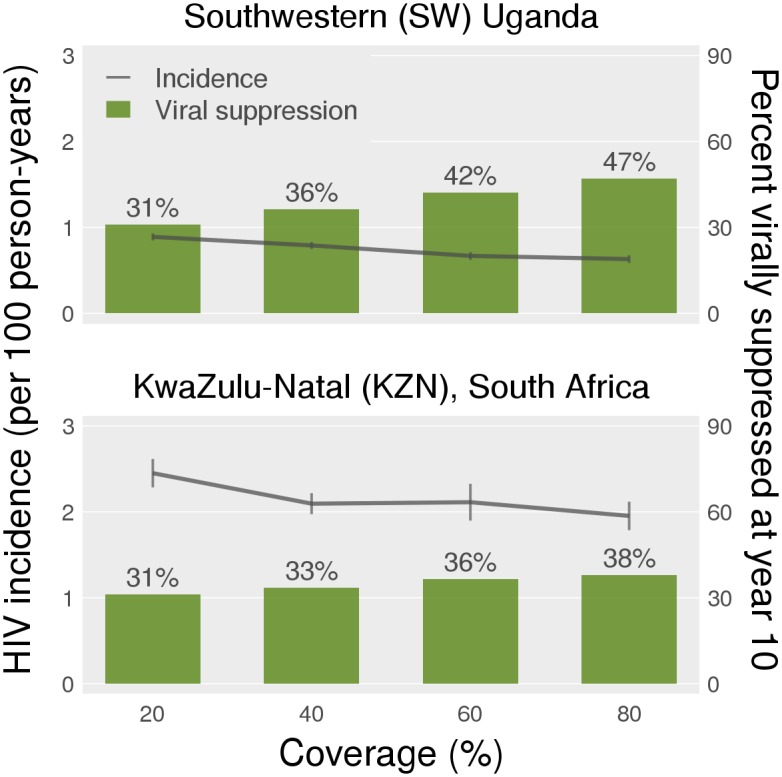
Fig 3. Mean HIV incidence rate in tenth year of Option B+ with High PMTCT coverage set at 20%, 40%, 60% and 80%.

ART coverage is held constant at Current levels. On the right axis, we see the mean proportion of virally suppressed individuals (viral load < 100 counts/ml), at the end of the tenth year of intervention.
