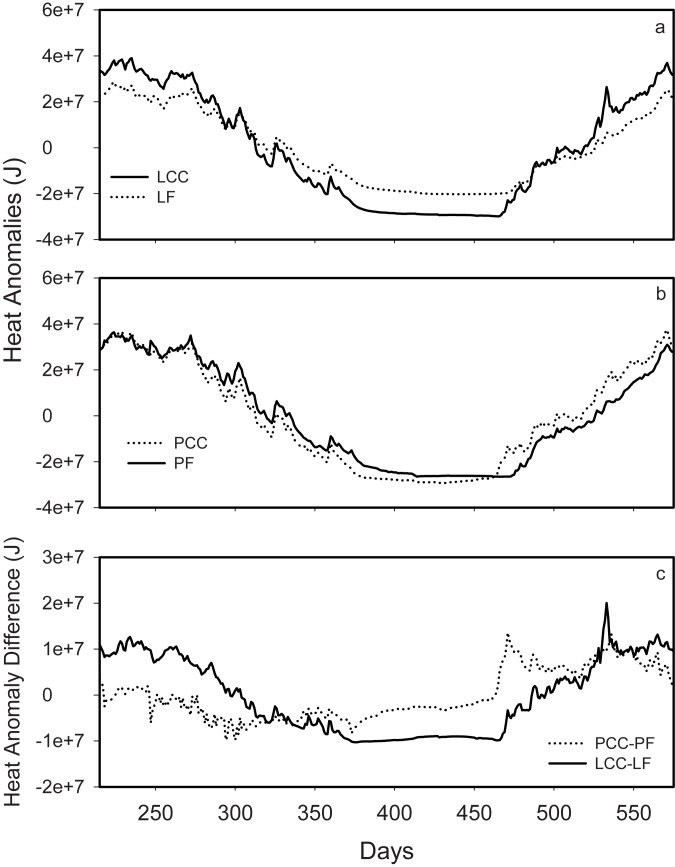
Fig 2. Annual time series of soil profile heat anomalies (J) for a) Lakevale clearcut (LCC) and forest (LF) sites, b) Pomquet clearcut (PCC) and forest (PF) sites, and c) soil profile heat anomaly differences for Lakevale and Pomquet sites.
The x-axis represents days since Jan 1 of the first year of sampling.

