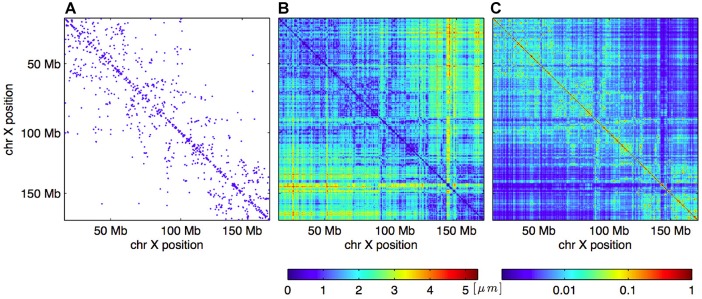
Fig 1. Example of generation of distance and weight matrices for the optimization procedure.

A: Original chromosomal contact map (C ij) based on chromosome X from cell 1. A blue dot indicates the presence of an observed interaction in the single-cell Hi-C data set. B: Distance matrix (D ij) consisting of Euclidean distances (in μm) corresponding to the contact map to the left after running the shortest-path algorithm. C: Corresponding weight matrix (H ij), containing numbers between 0 and 1 giving the weight for each of the distances in the Euclidean distance matrix to the left. See the Methods section for details.
