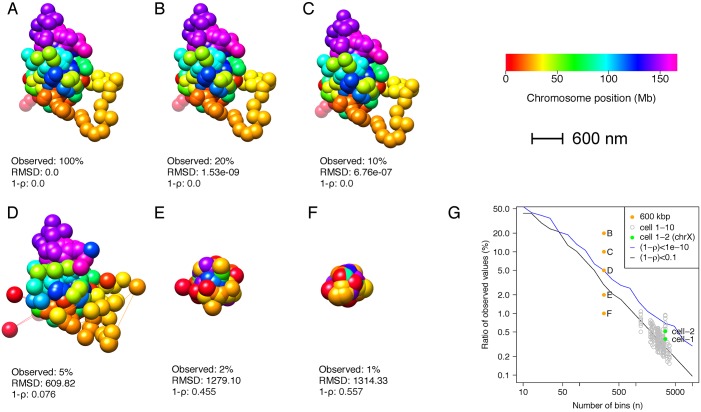
Fig 3. Reconstruction of chromosome X at different levels of observed information.
A: Original chromosome X structure from [18], resampled at 600 kbp. B-F: Reconstructed 3D structures of chromosome X, with different ratios of observed distance information (20%, 10%, 5%, 2% and 1%, respectively). Information about the RMSD (in nm) and 1 − ρ, compared to the original structure (A) is given below each of the structures in A-F. G: Ratio of observed values as a function of the number of bins n, i.e. the size of the structure being reconstructed. The structures in B-F are highlighted (orange dots), and compared to an estimated curve showing the minimum ratio of observed values for complete reconstruction ([1-ρ]<1e-10; blue curve) or partial reconstruction ([1-ρ]<0.1; black curve). All data from [18] are shown as gray circles, and the X chromosome data sets from cell 1 and cell 2 are highlighted in green.

