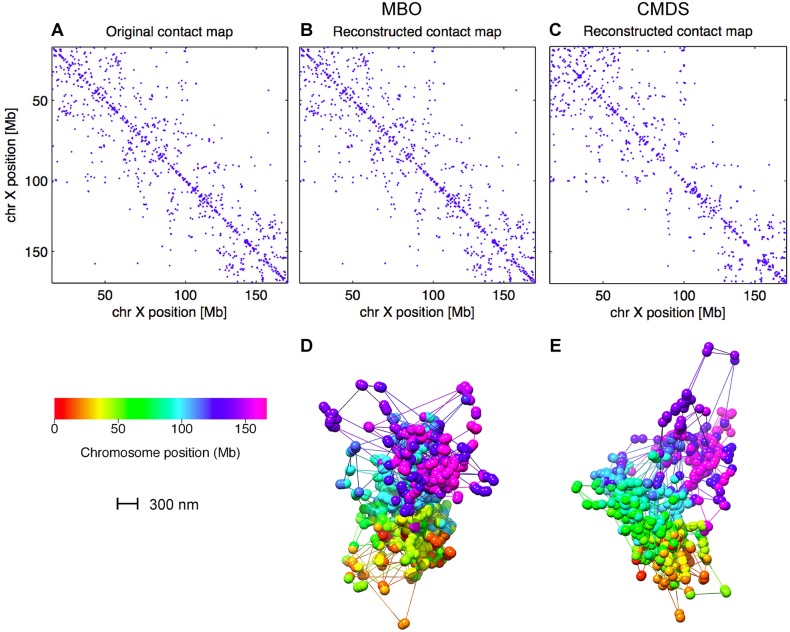
Fig 5. Contact map reconstruction comparison between MBO and CMDS.
A: Original contact map. Blue dot indicates the presence of a contact in the single-cell Hi-C data set for chromosome X (cell 1). B: Contact map obtained after 3D reconstruction using MBO, based on the contact map (in A) and then re-calculating the contacts. C: Reconstructed contact map, as in B, but using CMDS. D: Reconstructed 3D structure using MBO, corresponding to the contact map in B. E: Reconstructed 3D structure using CMDS, corresponding to the contact map in C. Each bead in D and E has a diameter of 150 nm. Lines represent connected beads with missing bead position information.

