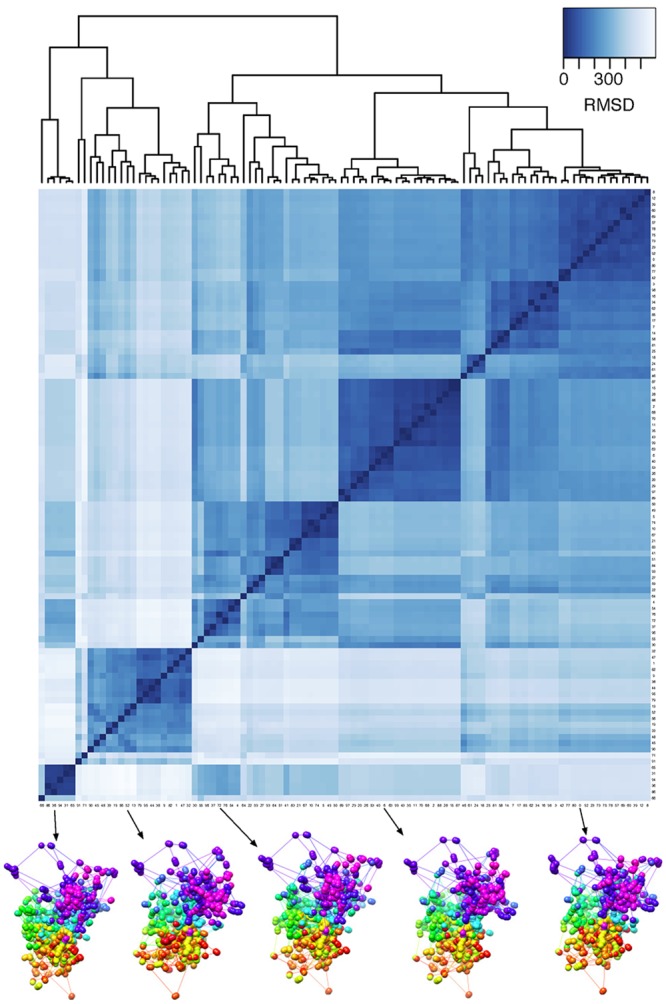
Fig 7. Clustering of chromosome X structural models.

The heatmap shows clustered RMSD values between 100 independent optimizations with random initial configurations prior to using MBO on chromosome X. The dendrogram above shows the result of the hierarchical clustering based on the RMSD values. At the bottom, 5 example structures from each cluster are shown.
