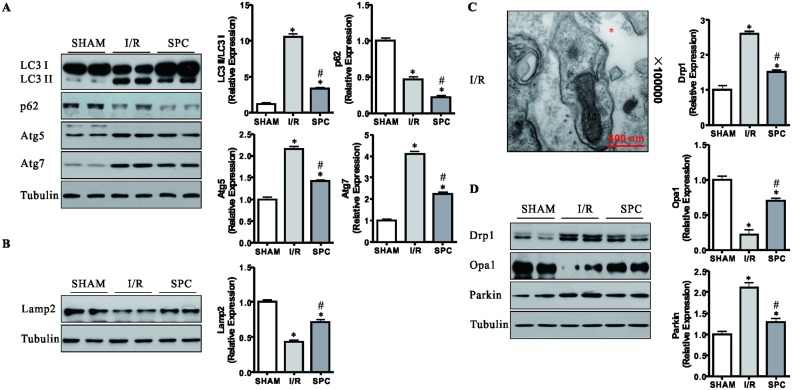
Fig 6. SPC can protect against I/R-induced mitochondrial fragmentation and ensuing mitophagy.
(A) The expression levels of LC3 II/I, p62, Atg 5 and Atg 7 are pivotal markers of autophagosome formation and clearance. Representative immunoblot for these proteins in the myocardial tissues from all groups and densitometric quantification. n = 4 /group. (B) The autophagosome clearance related Lamp 2 was found out. Representative protein bands and densitometric quantification were shown. Tubulin was used to an internal control. n = 4 per group. (C) Representative electron micrograph of the heart from the I/R group obtained at a magnification of 100000 times. Asterisk (*) indicates dissolved myofilaments. Scale bar: 400nm. n = 3 /group. (D) Immunoblotting was used to examine the levels of Drp1, Opa1 and Parkin. Representative protein images and quantitative analysis were shown. Expression was normalized to Tubulin for each sample. n = 4 /group. The columns and errors bars represent means ± SD. * P < 0.05 vs. SHAM group; # P < 0.05 vs. I/R group.

