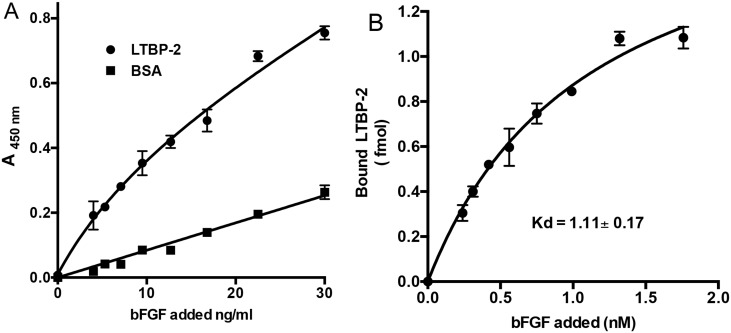
Fig 3. LTBP-2 interacts strongly with FGF-2.
A. Microtitre wells were coated with 200 ng rLTBP-2 or BSA control. After blocking, triplicate wells were incubated with 0–1.8 nM concentrations of FGF-2 (0–30 ng/ml) for 3 h at 37°C. FGF-2 binding was detected following sequential incubation of the wells with biotinylated mouse anti-[human FGF-2] antibody and streptavidin-HRP conjugate following the duoset protocol. Circles, LTBP-2; squares, BSA. Mean values ± S.D. of triplicate determinations are shown. B. Kd calculation. Following subtraction of the average BSA signal, the A450nm values were converted to fmol of FGF-2 using a standard ELISA curve (not shown). An additional graph was plotted of bound versus added FGF-2 and the Kd for interaction with LTBP-2 was calculated by non-linear regression analysis of the curve using the prism 4.0 program. Mean values ± S.D. from triplicate determinations are shown.

