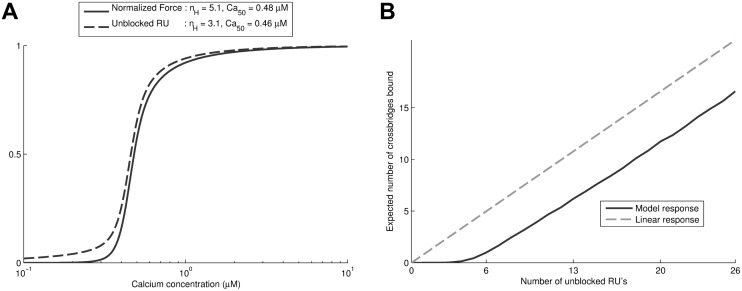
Fig 5. Steady-state model behaviour.
Panel A shows the Force-calcium curve relationship of the model alongside the RU unblocking as a function of calcium. This shows that the Force-calcium curve is significantly steeper than RU activation, as indicated by its higher Hill coefficient. Panel B explains this effect by looking at the expected number of crossbridges on tropomyosin chains with a fixed number of RU’s unblocked, where the probability of tropomyosin sub-states is according to Boltzmann’s law. This shows that there is significant inhibition of crossbridge binding at low numbers of RU’s, compared to models where the ‘linear response’ of crossbridge binding being proportional to the number of unblocked RU’s is assumed.

