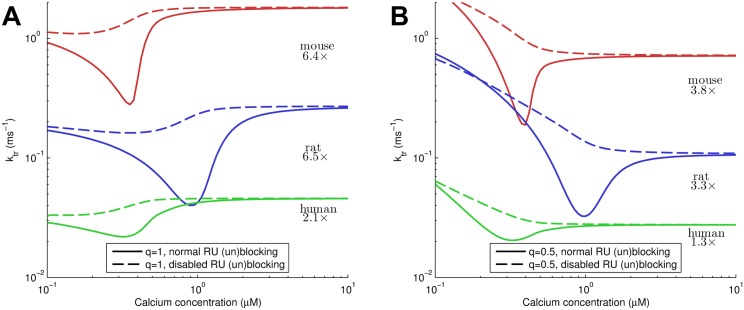
Fig 8. Tension redevelopment rates in mouse, rat and human.
Panel A shows results for q = 1 (constant crossbridge unbinding rate), and Panel B plot results for q = 0.5 (variable crossbridge unbinding rate). Each plot shows both normal kinetics, and with RU (un)blocking due to TnI-actin binding disabled for mouse, rat, and human parametrizations of the model. The difference in k tr when disabling RU (un)blocking reveals the influence of transient blocking of RU’s on tension redevelopment kinetics. This transient blocking causes a significant difference between the minimum k tr and the k tr at high [Ca2+], the ratio of which is indicated with the results. Note the shift in the minimum k tr is not significant here as it is a direct result of the difference in peak calcium shown in Fig 7A and subsequent parametrization.

